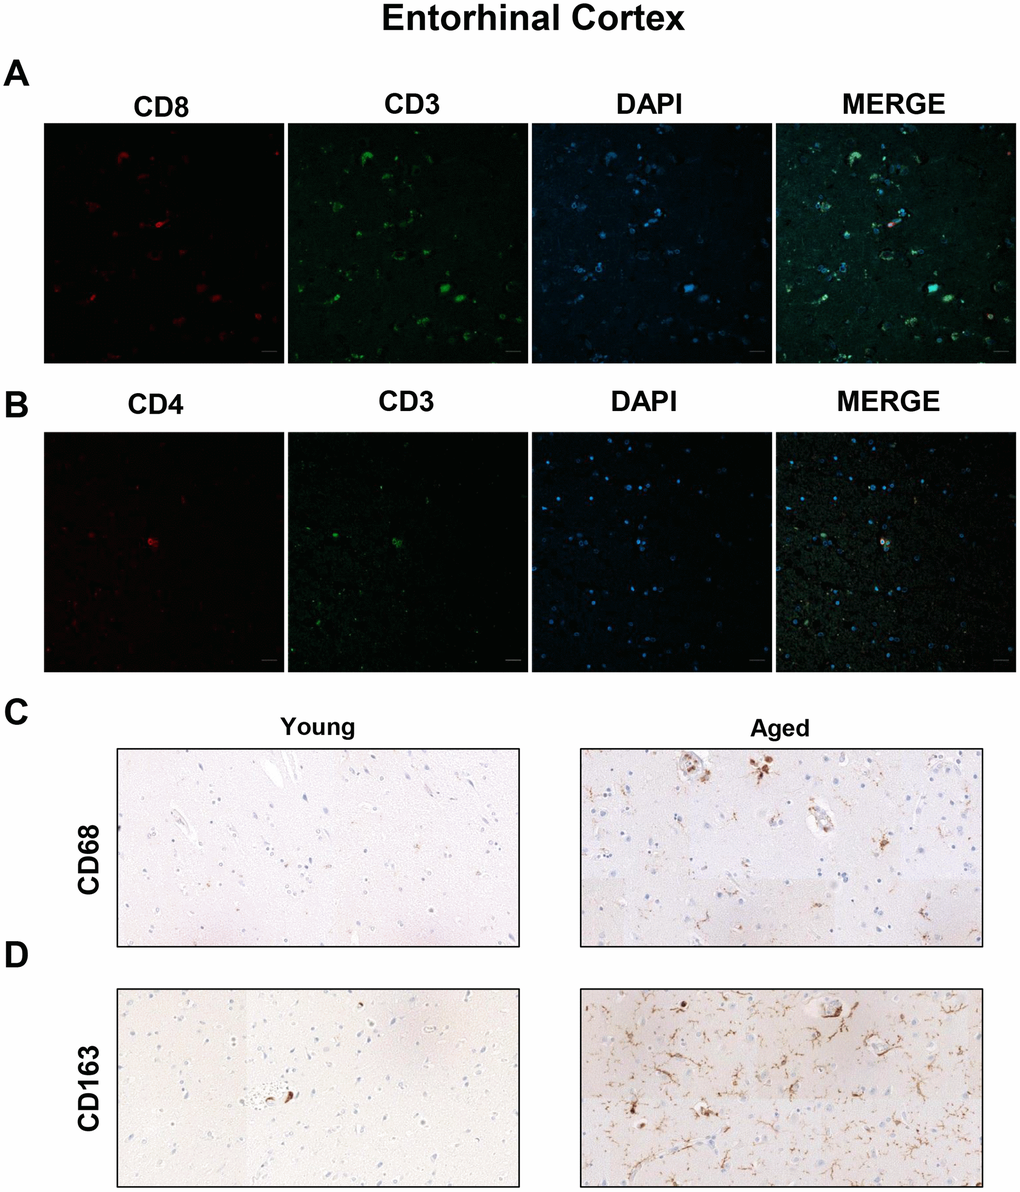
Figure 4.Presence of cytotoxic CD8+ T cells in the entorhinal cortex of aged individuals. (A) Co-immunofluorescence of CD8 with CD3 marker (n=4). (B) Co-immunofluorescence of CD3 with CD4 marker (n=4). Cell nuclei were counterstained with DAPI. Scale bar: 20 μm. (C, D) Representative images of CD68 and CD163 microglia markers in young and aged individuals (n=3). Images were obtained using the 20× objective.