Aging
Navigate
Back to articleFigure 1(1 of 5)
100%
Figure 1
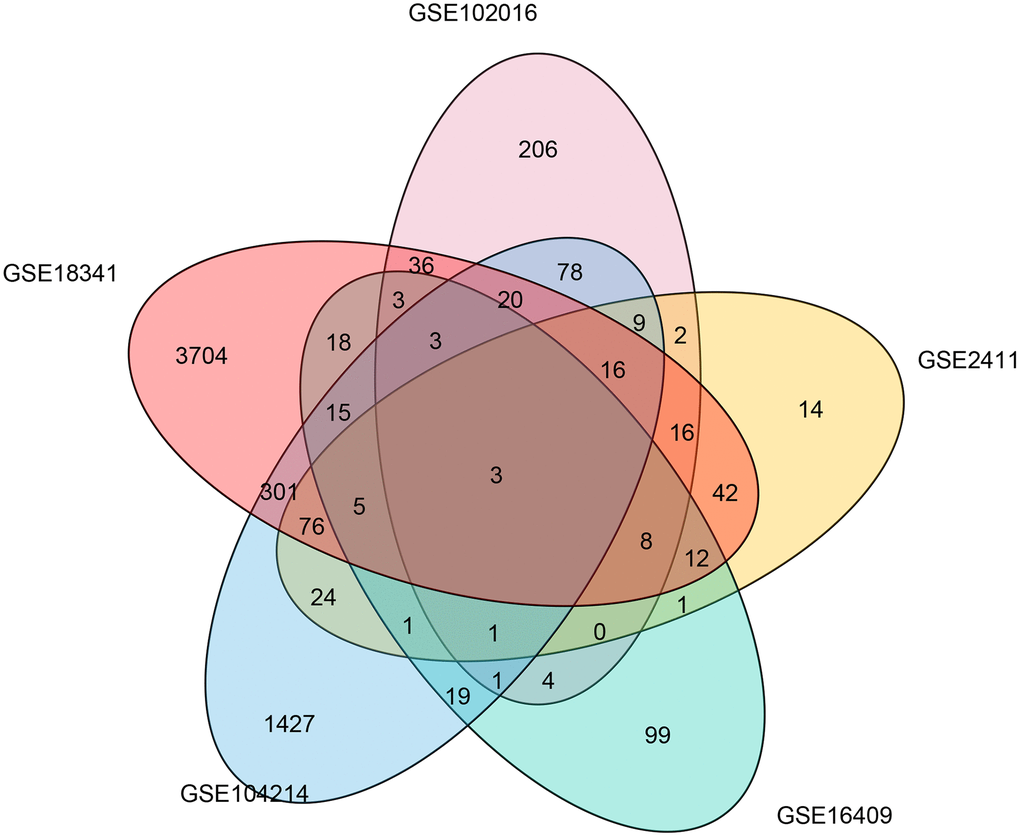
Figure 1.Common differentially expressed genes associated with LPS induction in five microarray studies. A Venn diagram was constructed to show the overlapping differentially expressed genes associated with LPS induction identified in five microarray studies.
Figure 1 — Identification of robust genetic signatures associated with lipopolysaccharide-induced acute lung injury onset and astaxanthin therapeutic effects by integrative analysis of RNA sequencing data and GEO datasets | Aging