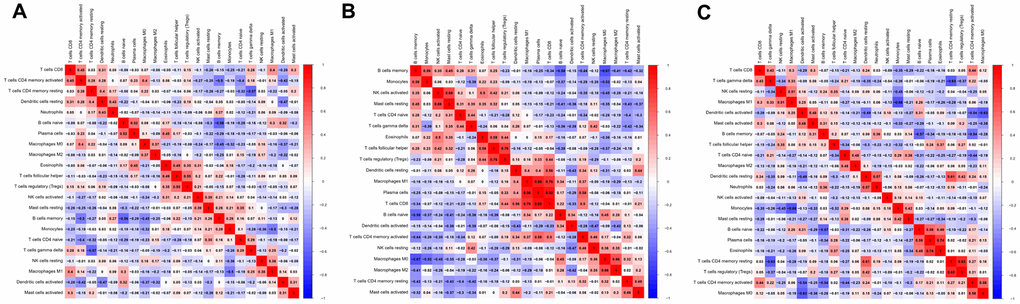
Figure 4.Correlation matrix of all 22 immune cell densities in different groups. The results are shown for all tissues (A), non-metastatic tissues (B) and metastatic tissues (C). Red indicates a positive correlation, while blue indicates a negative correlation; the darker the color, the stronger the correlation. The results were generated using the R software package corrplot.