Submit an Article
Navigate
Home
Editorial Board
Editorial Policies
Current Volume
Archive
Scientific Integrity
Publication Ethics Statements
Interviews with Outstanding Authors
Newsroom
Sponsored Conferences
Podcast
Contact
Special Collections
Submit an Article
Online ISSN: 1945-4589
Research Paper
|
Volume 12, Issue 22
|
pp. 23004–23016
Patrolling monocytes inhibit osteosarcoma metastasis to the lung
Back to article
Figure 1
(1 of 8)
−
100%
+
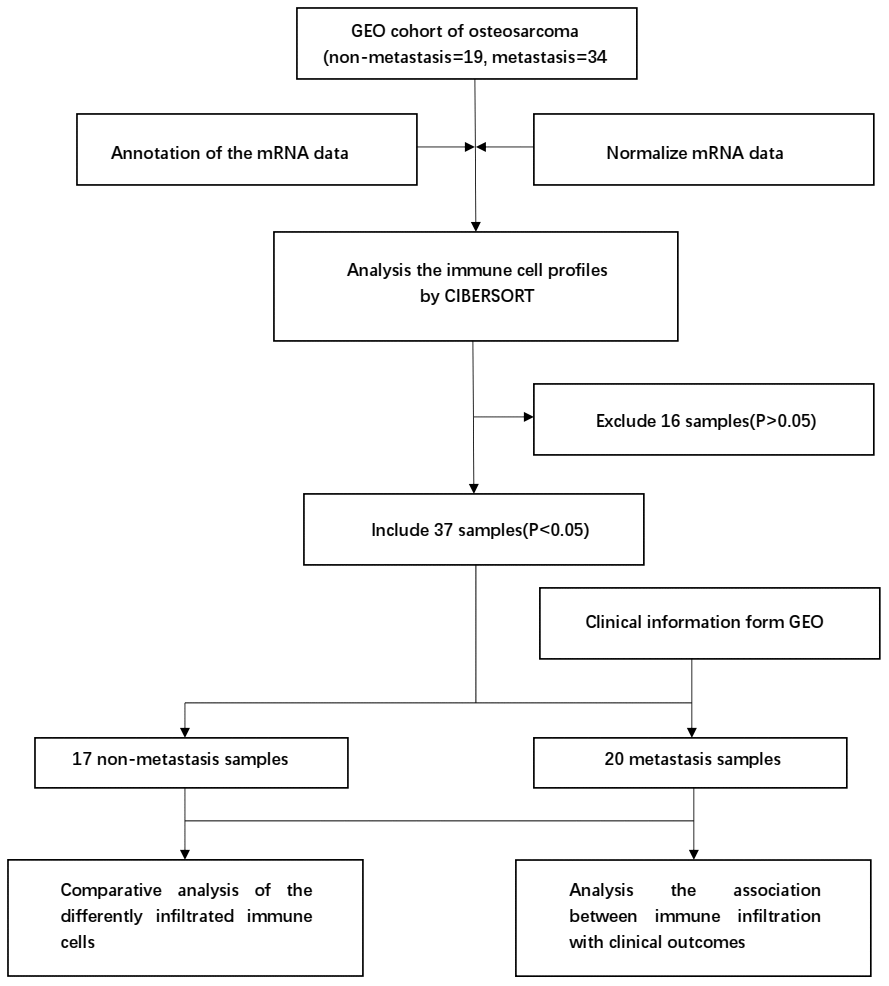
Figure 1.
Flowchart detailing the study design and samples at each stage of analysis.