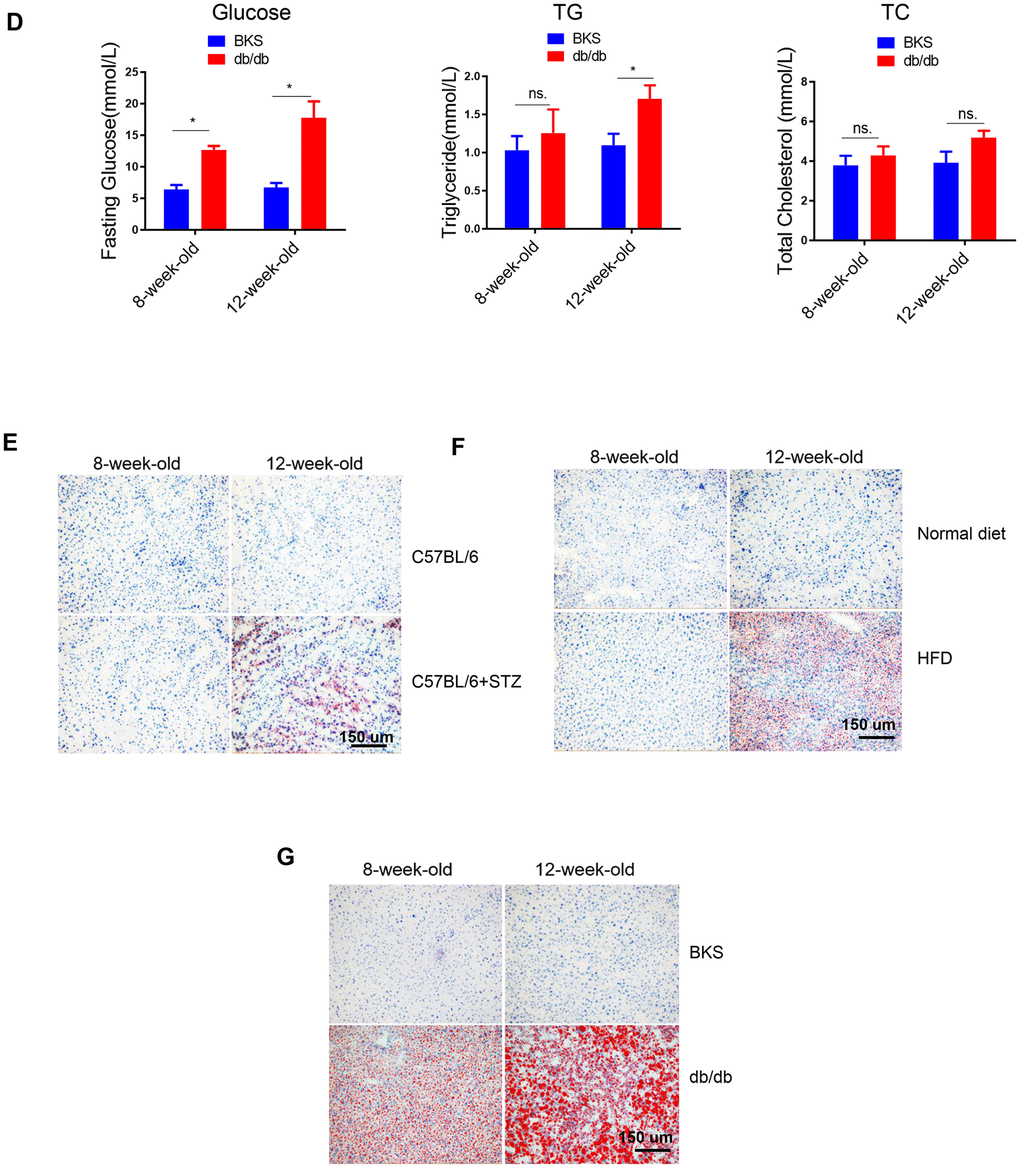
Figure 1.Lipid content in the liver of differently treated mice. (D) Time course analysis of circulating glucose, TG, TC levels in db/db mice in comparison with wild type mice (n=3-4, *p<0.05). (E–G) Representative image of liver lipid contents detected by oil-red staining in STZ-treated C57BL/6 mice (E), HFD-treated C57BL/6 mice (F) and db/db mice (G).