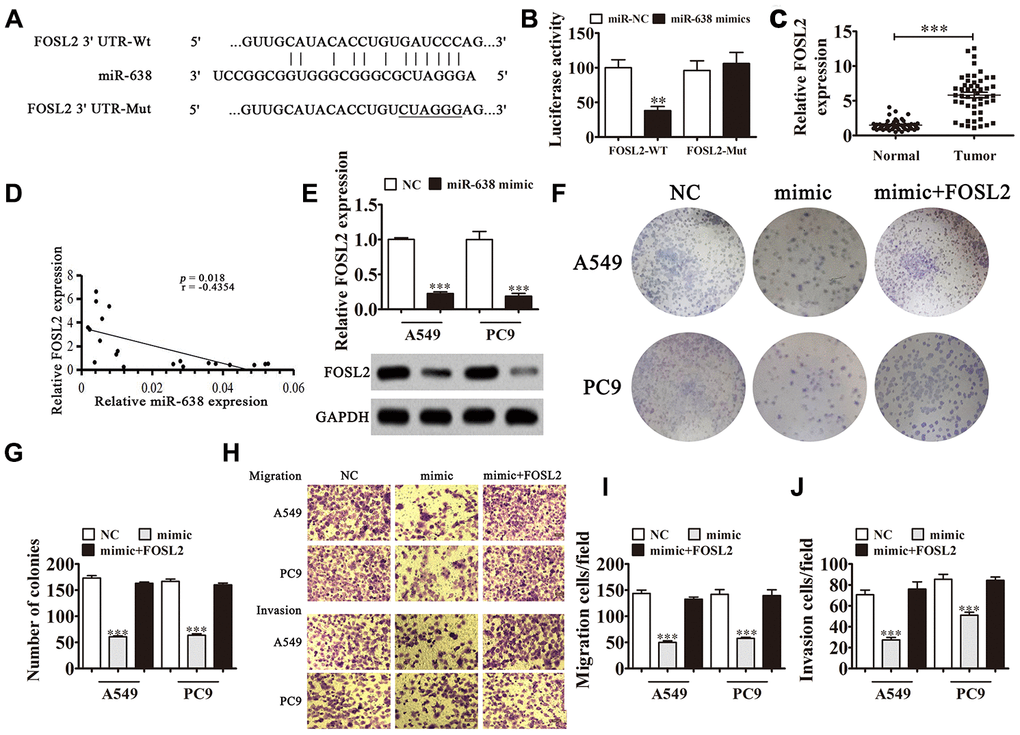
Figure 6.FOSL2 is a downstream target of the FOSL2/miR-638 axis. (A) Predicted binding sites in 3′-UTR-FOSL2 for miR-638. Mutated (Mut) version of 3′-UTR-FOSL2 is shown. (B) Relative luciferase activity was determined 48 h after transfection with miR-638 mimic/normal control (NC) or 3′-UTR-FOSL2 wild-type/Mut in HEK293T cells. Data are expressed as mean ± SD. ***P < 0.001. (C) FOSL2 expression was examined in NSCLC tissues and matched peritumor samples using qRT-PCR. FOSL2 expression was significantly increased in NSCLC tissues compared to that in peritumor samples. Data are expressed as mean ± SD, n = 50. ***P < 0.001 vs. normal tissues. (D) Significant negative correlation was observed between FOSL2 and miR-638 in NSCLC tissues: n = 50, P = 0.018. (E) qRT-PCR was used to investigate FOSL2 levels in miR-638-overexpressing A549 and PC9 cells. n = 3. Data are expressed as mean ± SD. ***P < 0.001 vs. NC. (F and G) Colony formation assay revealed the colony-forming ability of A549 and PC9 cells after overexpression of miR-638 with or without FOSL2 overexpression (LV-FOSL2 or FOSL2). n = 3. Data are expressed as mean ± SD. ***P < 0.001 vs. NC. (H–J) Cell migration and invasion were determined for A549 and PC9 cells using the Transwell® assay. Data are expressed as mean ± SD. ***P < 0.001 vs. NC.