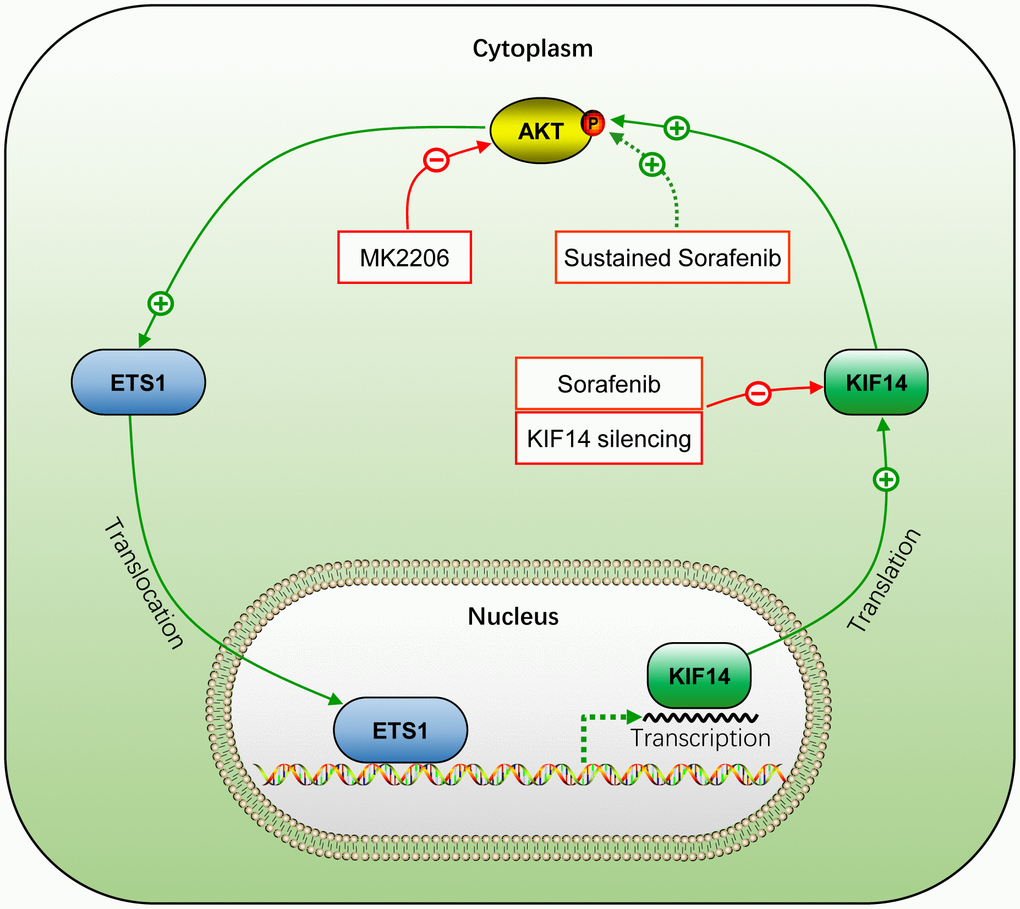
Figure 8.Schematic representation of the activation of AKT–ETS1–KIF14 positive feedback loop during acquired resistance to sorafenib in HCC. +, positive regulation or activation; −, negative regulation or blockade; p, regulation by phosphorylation. The solid line indicates direct interaction, whereas the dotted line indicates indirect interaction.