Submit an Article
Navigate
Home
Editorial Board
Editorial Policies
Current Volume
Archive
Scientific Integrity
Publication Ethics Statements
Interviews with Outstanding Authors
Newsroom
Sponsored Conferences
Podcast
Contact
Special Collections
Submit an Article
Online ISSN: 1945-4589
Research Paper
|
Volume 12, Issue 21
|
pp. 20997–21003
Evaluation of droplet digital PCR for quantification of SARS-CoV-2 Virus in discharged COVID-19 patients
Back to article
Figure 2
(2 of 2)
−
100%
+
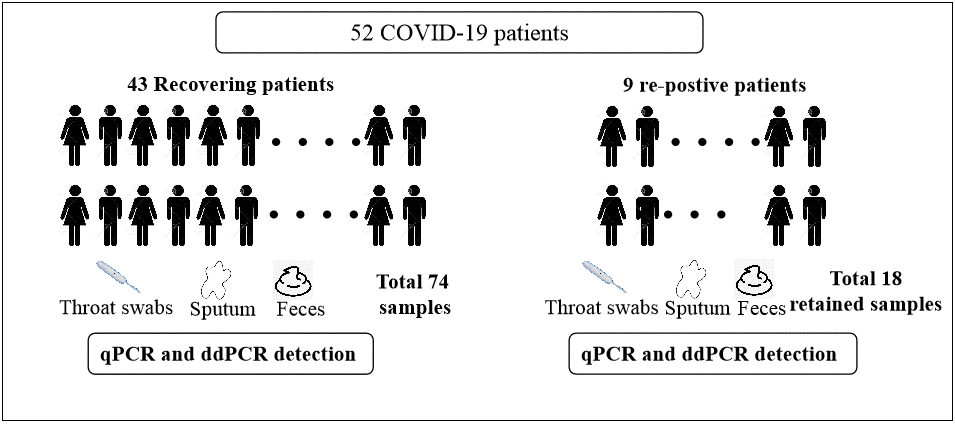
Figure 2.
Flow diagram of the study population.