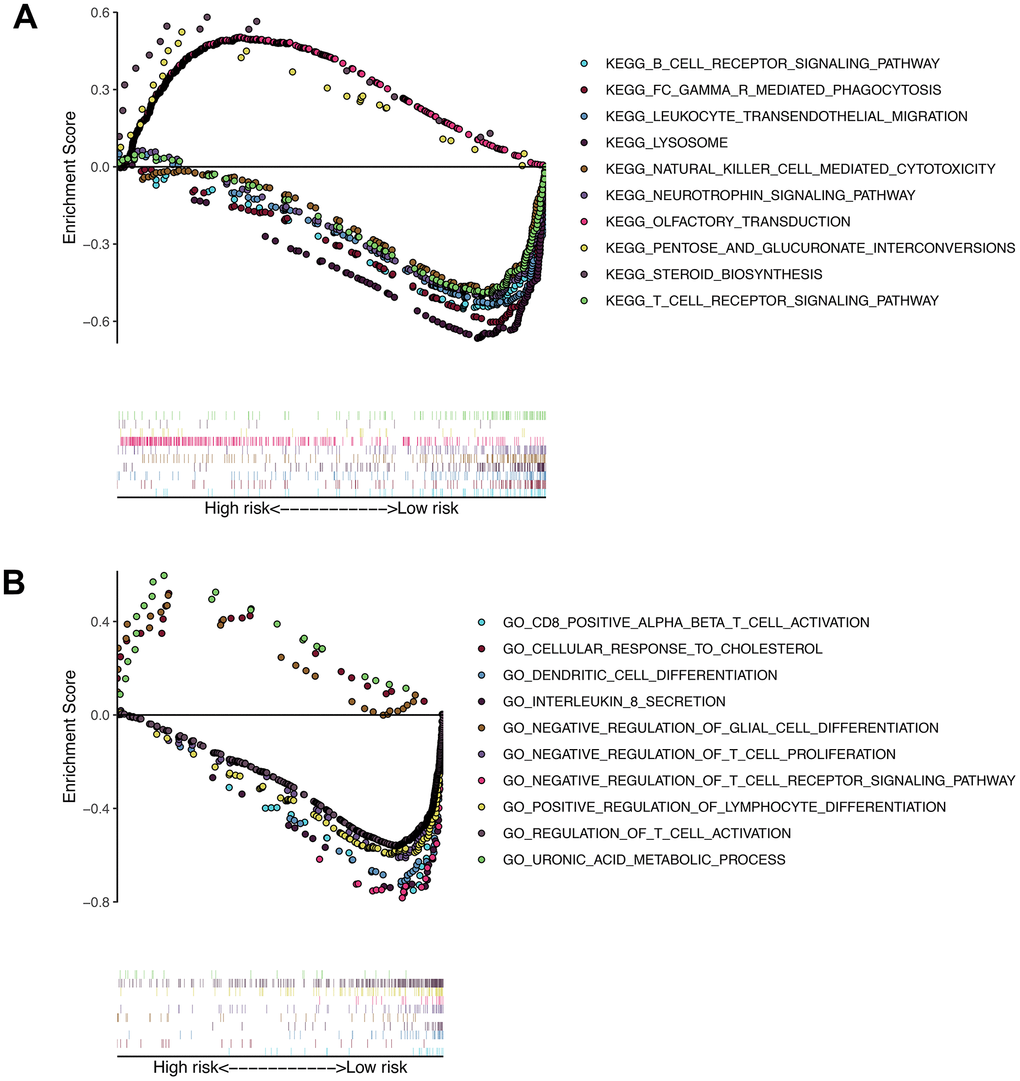
Figure 9.Results of gene set enrichment analysis in the TCGA cohort. (A) The significantly enriched KEGG pathways in TCGA cohort by GSEA. (B) The significantly enriched GO terms in TCGA cohort by GSEA.
Figure 9 — Construction of immune-related gene pairs signature to predict the overall survival of osteosarcoma patients | Aging