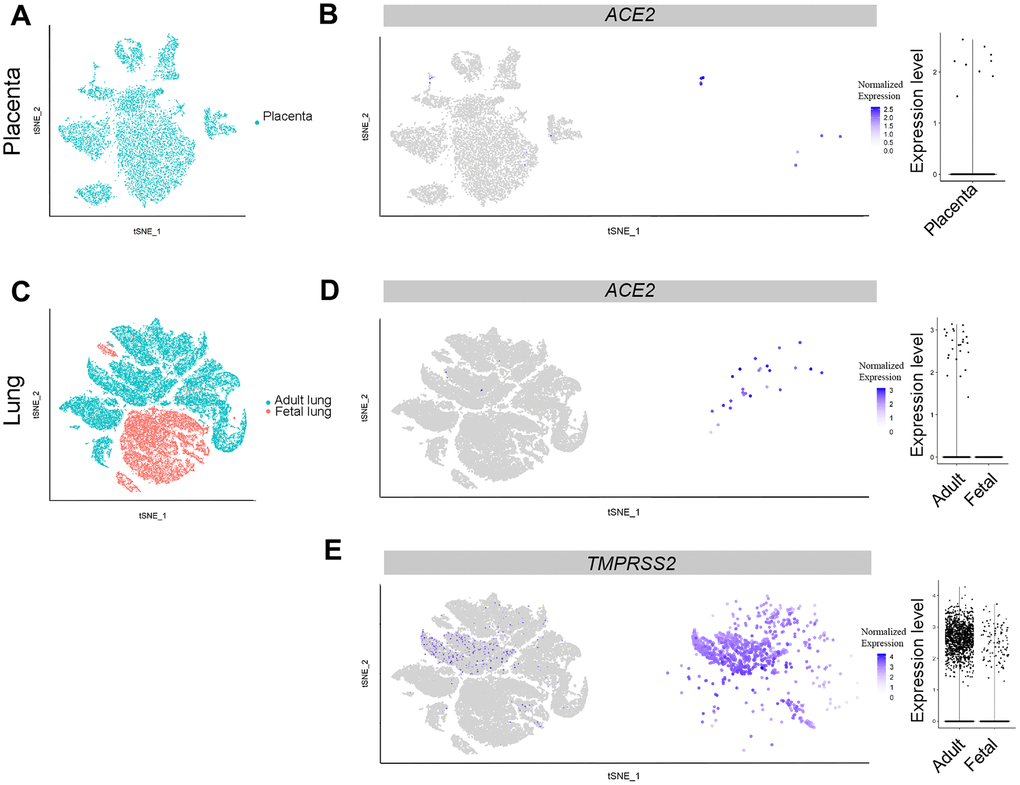
Figure 1.Single-cell analysis of lungs and placenta. (A) t-distributed stochastic neighbor embedding (TSNE) plot showing sub-clusters of placenta cells, and (B) ACE2 expression in placenta. (C) TSNE plot showing sub-clusters of lung cells, (D) ACE2 and (E) TMPRSS2 expression in lungs from the adult and fetal groups.