Submit an Article
Navigate
Home
Editorial Board
Editorial Policies
Current Volume
Archive
Scientific Integrity
Publication Ethics Statements
Interviews with Outstanding Authors
Newsroom
Sponsored Conferences
Podcast
Contact
Special Collections
Submit an Article
Online ISSN: 1945-4589
Research Paper
|
Volume 12, Issue 21
|
pp. 21854–21873
Three-gene risk model in papillary renal cell carcinoma: a robust likelihood-based survival analysis
Back to article
Figure 9
(9 of 11)
−
100%
+
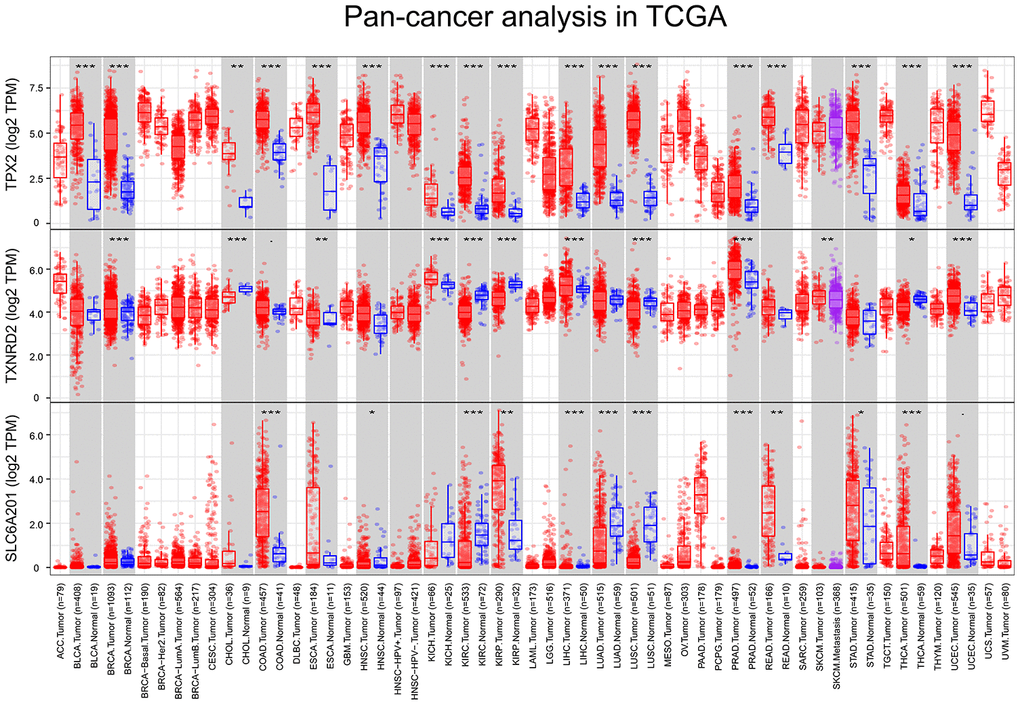
Figure 9.
The variation analysis of 33 types of cancer in TCGA, P <0.05 was marked as *, P < 0.01 was marked as **, P < 0.001 was marked as ***.
(
A
) TPX2, (
B
) TXNRD2, (
C
) SLC6A20.