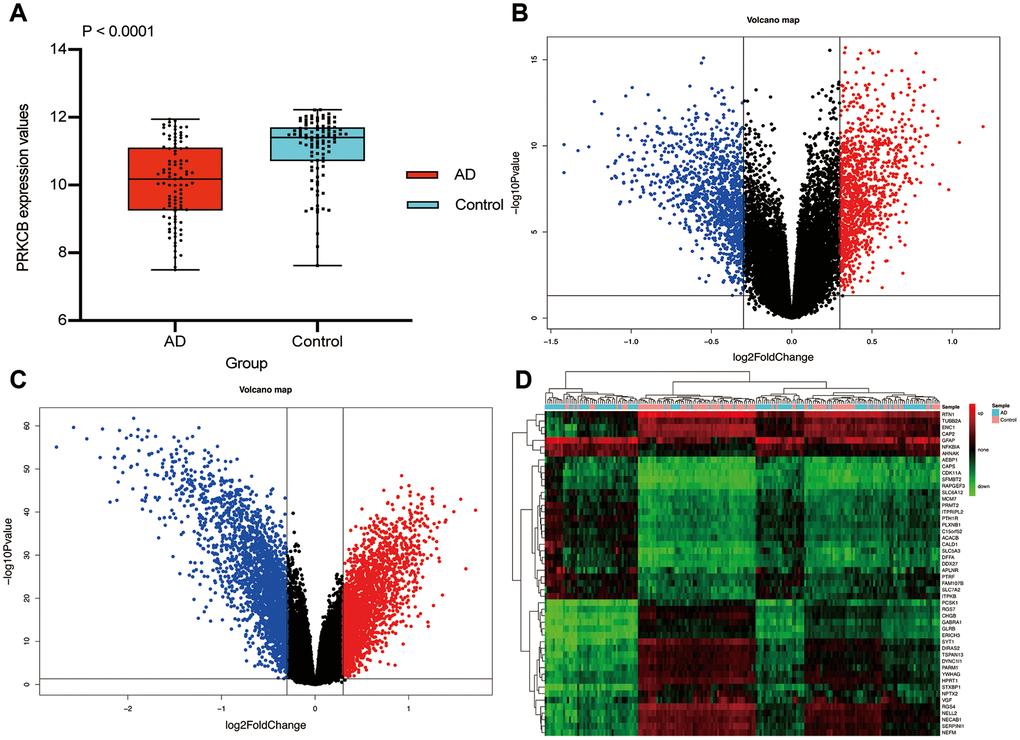
Figure 2.Differential expression gene analysis. The expression of PRKCB in AD and non-dementia controls (A) Volcano plot of the AD / control (B) and PRKCB-low / high group (C) blue, black and red indicate down-regulated, non-significant and up-regulated DEGs, respectively. The heatmap of the top 25 down-regulated and up-regulated DEGs (D) AD: Alzheimer’s disease, DEGs: differential expression genes.