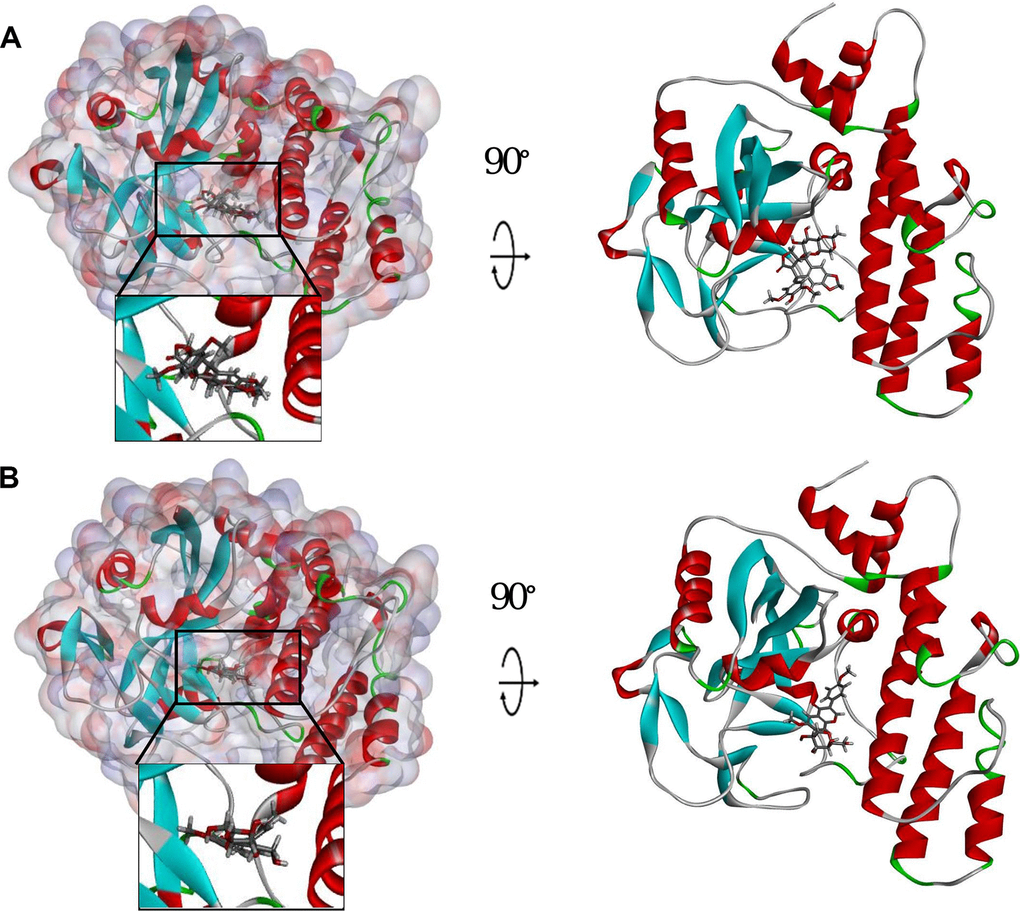
Figure 3.Schematic drawing of interactions between ligands and PARP. The surface of binding area was added. Blue represents positive charge; red represents negative charge; and ligands are shown in sticks, with the structure around the ligand-receptor junction shown in thinner sticks. (A) ZINC000003938684-PARP complex. (B) ZINC000014811844-PARP complex.