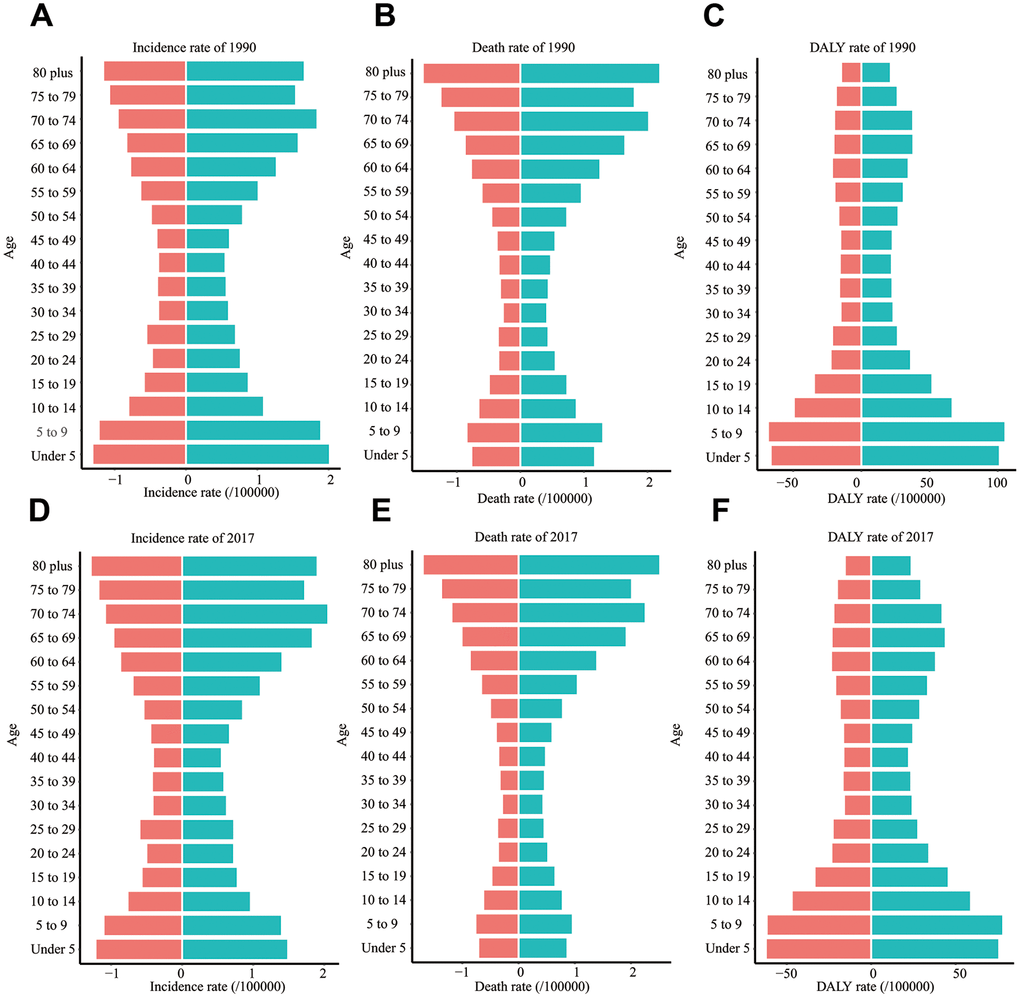
Figure 5.The incidence rate, death rate, and DALY rate of ALL in different age groups. (A) The incidence rate in 1990. (B) The death rate in 1990. (C) DALY rate in 1990. (D) The incidence rate in 2017. (E) The death rate in 2017. (F) DALY rate in 2017. EAPC: estimated annual percentage change; DALY: disability-adjusted life year; SDI: Socio-demographic Index.