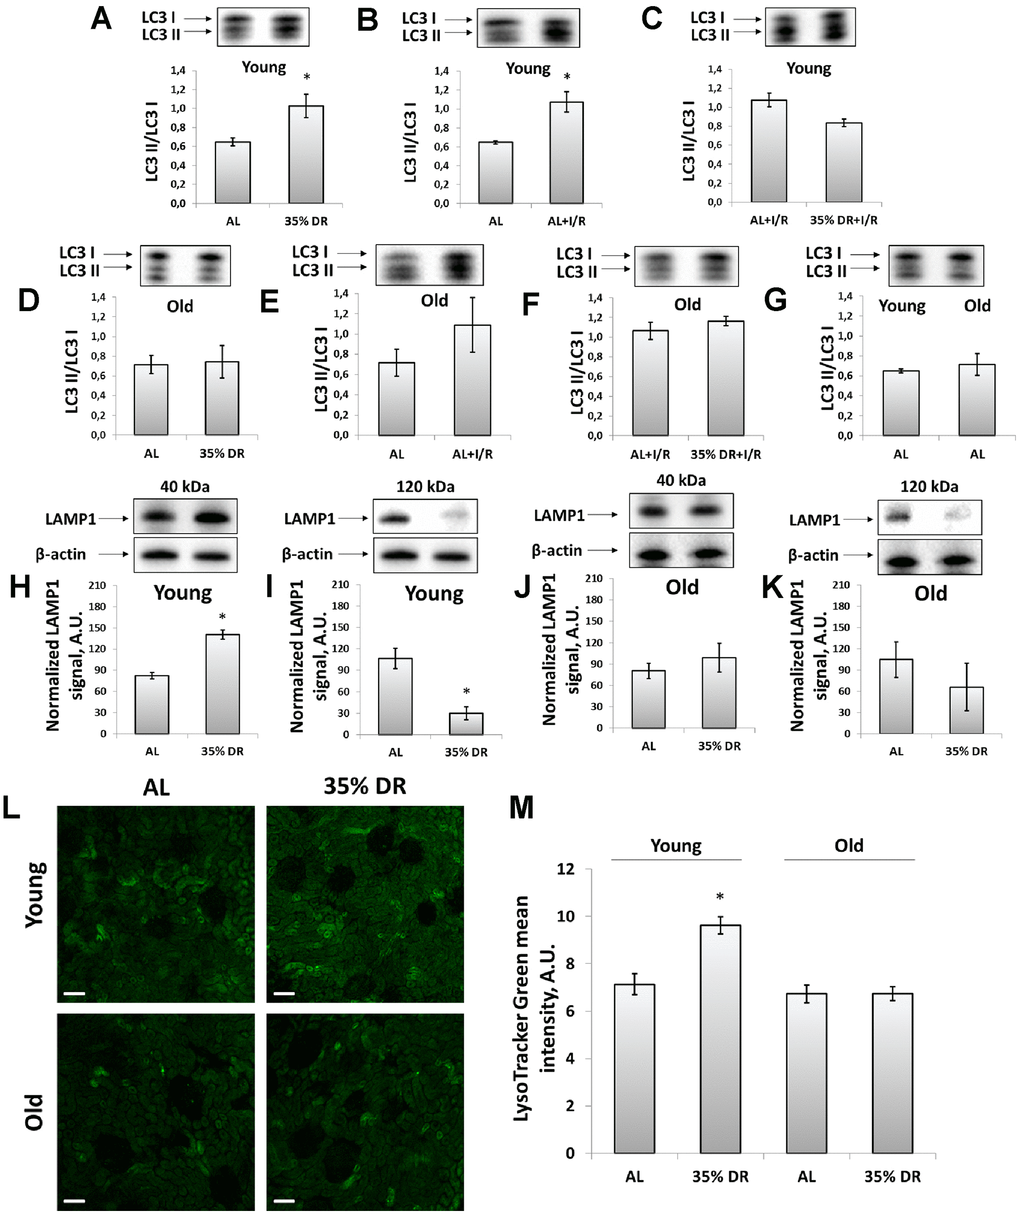
Figure 3.Assessment of autophagic activity in young and old rats. (A) LC3 II/LC3 I ratio in kidney tissue of young rats in response to DR; (B) LC3 II/LC3 I ratio in kidney tissue of young rats in response to I/R; (C) The comparison of LC3 II/LC3 I ratio in kidney tissue of young rats after I/R with or without DR diet; (D) LC3 II/LC3 I ratio in kidney tissue of old rats in response to DR; (E) LC3 II/LC3 I ratio in kidney tissue of old rats in response to I/R; (F) The comparison of LC3 II/LC3 I ratio in kidney tissue of old rats after I/R with or without DR diet; (G) Comparison of LC3 II/LC3 I ratio in kidney tissue of young and old rats; (H, I) Levels of non-glycosylated (40 kDa) and glycosylated (120 kDa) forms of LAMP1 in kidney tissue of young rats; (J, K) Levels of non-glycosylated (40 kDa) and glycosylated (120 kDa) forms of LAMP1 in kidney tissue of old rats; (L) Lysosomes staining with LysoTracker Green probe revealed by confocal microscopy of vital kidney slices. Scale bar, 100 μm; (M) Quantification of LysoTracker Green fluorescence intensity. *p < 0.05 compared to AL-group. For young AL rats n=5, for young DR rats n=6, for old AL rats n=6, for old DR rats n=5. AL, ad libitum, DR, dietary restriction, I/R, ischemia/reperfusion.