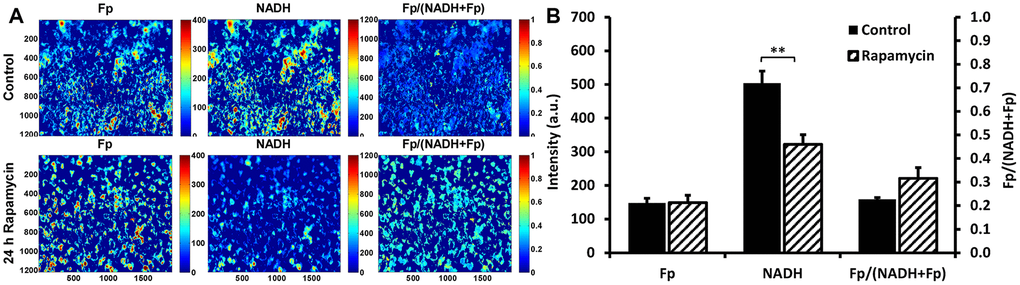
Figure 5.Optical redox imaging of live C2C12 myoblasts. (A) Typical redox images of control or rapamycin-treated cells, where the color bars in Fp or NADH images represent the intensities of the signals in arbitary unit and that for Fp/(NADH+Fp) represents the redox ratio ranging from 0 to 1; (B) Quantification of the redox imaging results (unpaired 2-tailed Student’s t test assuming unequal variance), n = 4. **, P < 0.01. All data shown as mean ± SEM.