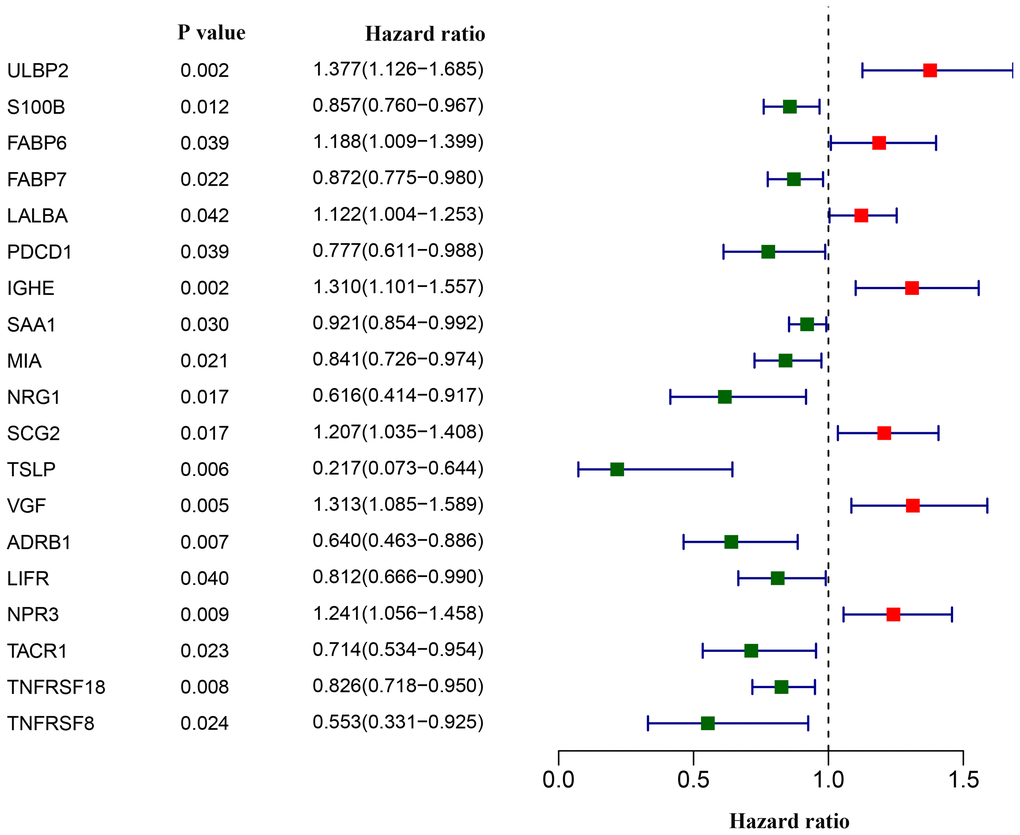
Figure 3.Screening of differentially expressed immunity-related genes correlated with overall survival in breast cancer. The forest plot shows hazard ratios of each gene.
Figure 3 — Construction and validation of an immunity-related prognostic signature for breast cancer | Aging