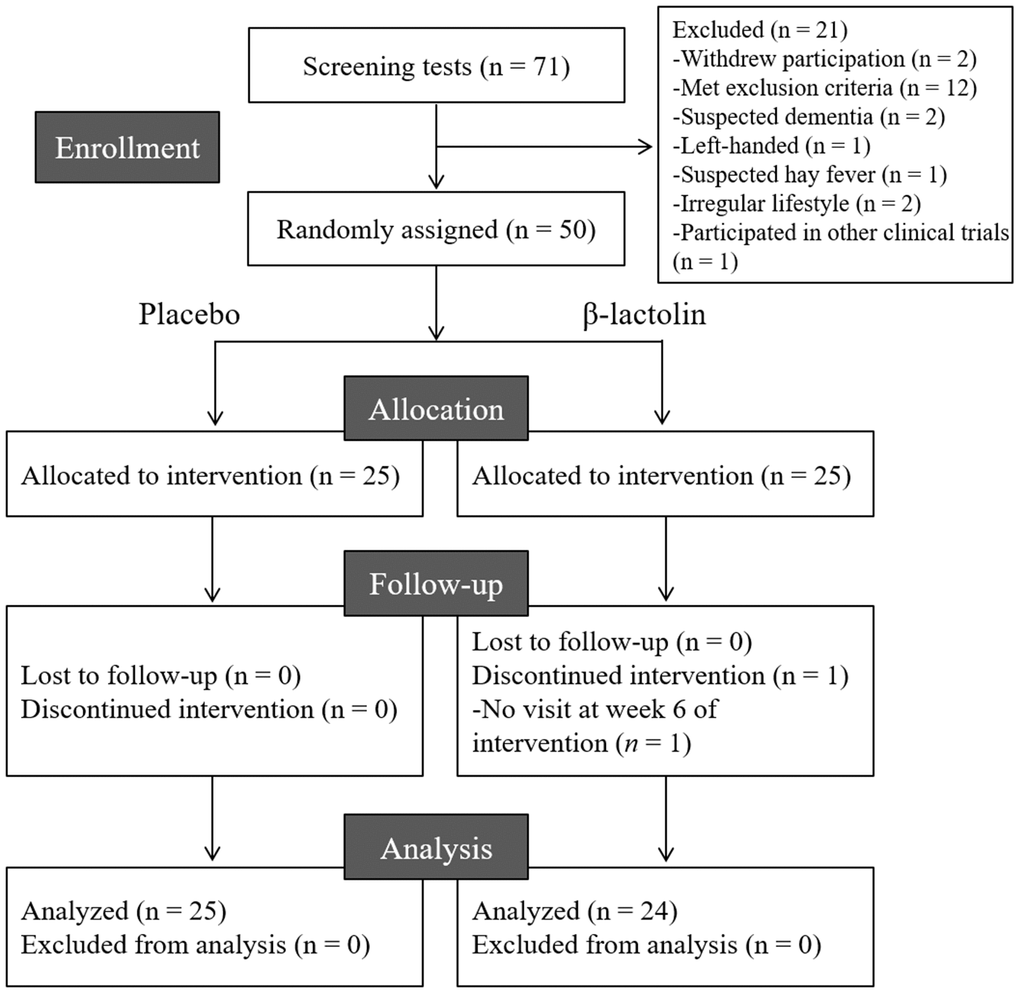
Figure 1.CONSORT diagram. We included 50 of the 71 screened participants in this study; they were randomly allocated to the placebo (n = 25) and β-lactolin (n = 25) groups. One participant dropped out and, therefore, the data of 25 and 24 participants in the placebo and β-lactolin groups were analyzed, respectively.