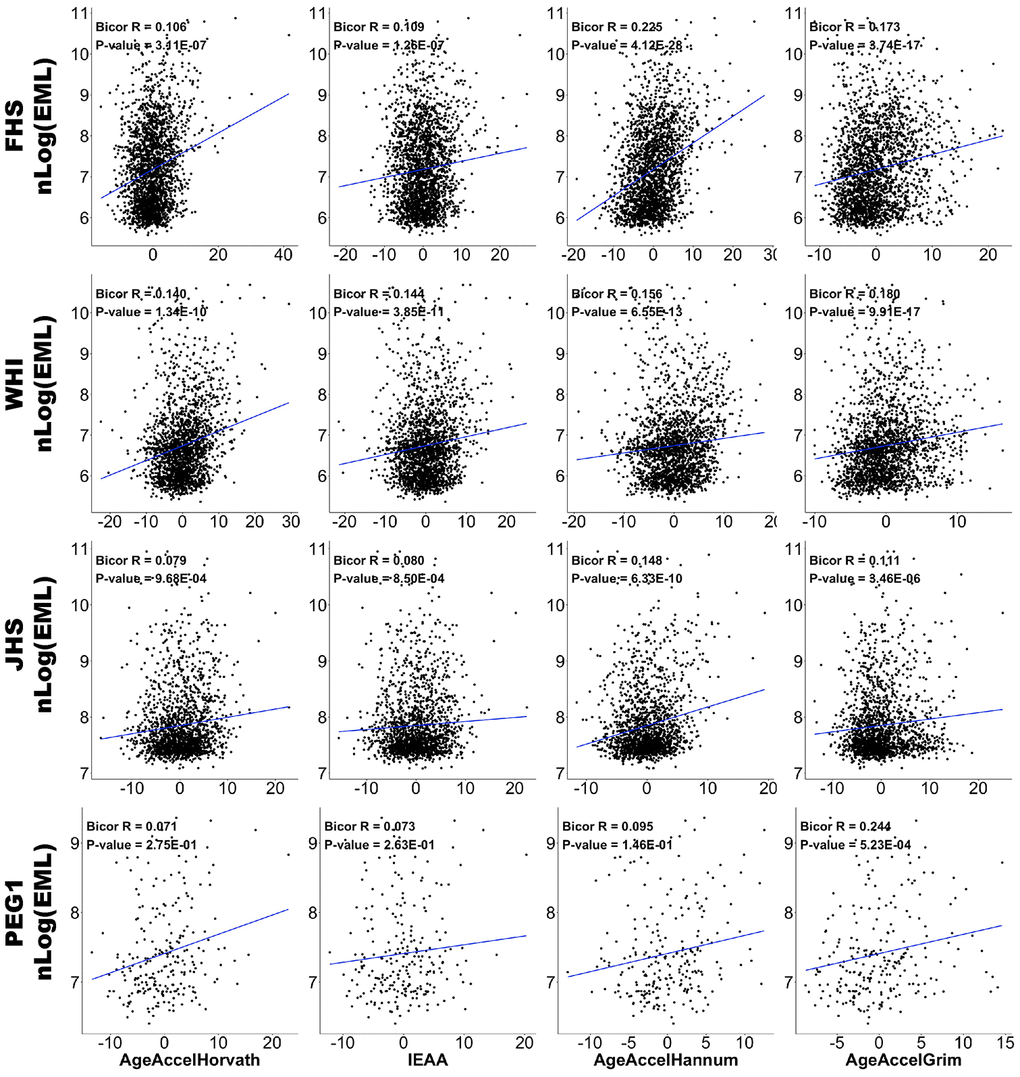
Figure 2.Correlations between EML and epigenetic age accelerations. Scatter plots of DNAm age acceleration estimators (x-axis; AgeAccelHorvath, IEAA, AgeAccelHannum, and AgeAccelGrim in each column, respectively) versus natural log-transformed EMLs (y-axis). Data from FHS, WHI, JHS, and PEG1 are plotted in four rows respectively. Each panel reports a biweight midcorrelation coefficient and correlation test p-value.