Submit an Article
Navigate
Home
Editorial Board
Editorial Policies
Current Volume
Archive
Scientific Integrity
Publication Ethics Statements
Interviews with Outstanding Authors
Newsroom
Sponsored Conferences
Podcast
Contact
Special Collections
Submit an Article
Online ISSN: 1945-4589
Research Paper
|
Volume 12, Issue 22
|
pp. 22814–22839
Analysis of DNA methylation-driven genes for predicting the prognosis of patients with colorectal cancer
Back to article
Figure 7
(7 of 7)
−
100%
+
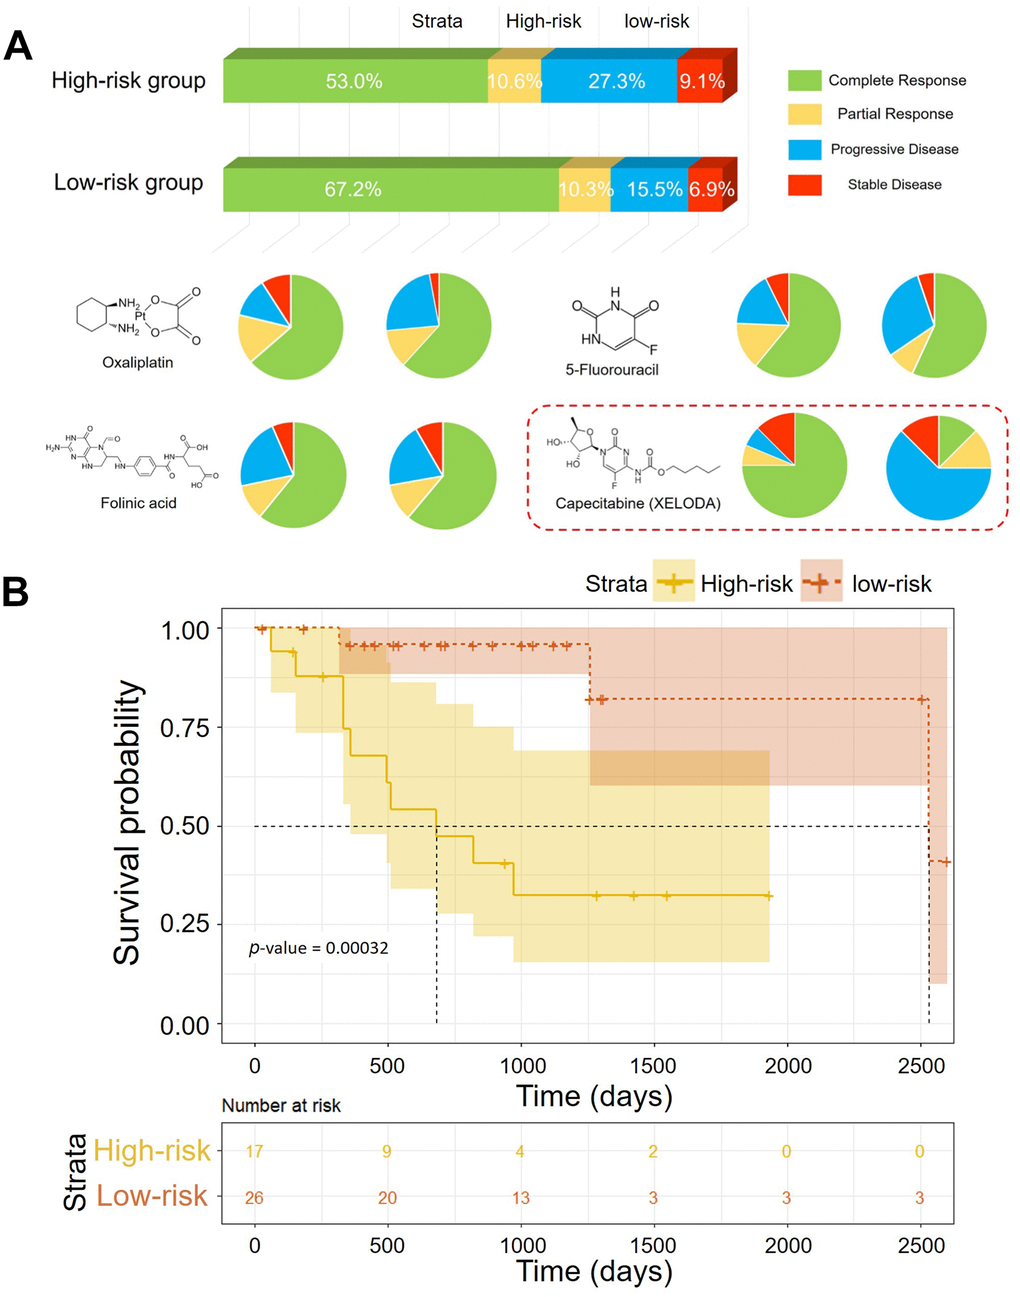
Figure 7.
(
A
) Pharmaceutical treatment responses of patients in the low-risk group and the high-risk group. (
B
) Kaplan–Meier curves of the OS of patients treated with XELODA in TCGA (
p
-value = 0.00032).