Submit an Article
Navigate
Home
Editorial Board
Editorial Policies
Current Volume
Archive
Scientific Integrity
Publication Ethics Statements
Interviews with Outstanding Authors
Newsroom
Sponsored Conferences
Podcast
Contact
Special Collections
Submit an Article
Online ISSN: 1945-4589
Research Paper
|
Volume 12, Issue 19
|
pp. 19628–19640
Risk factors and prediction of second primary cancer in primary female non-metastatic breast cancer survivors
Back to article
Figure 4
(4 of 5)
−
100%
+
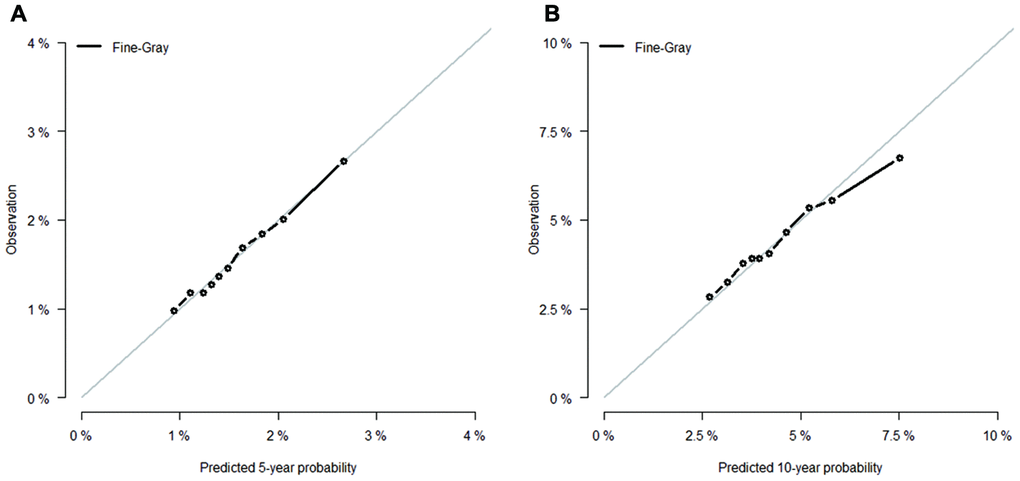
Figure 4.
Calibration curves for (
A
) 5- and (
B
) 10-year predictions from Fine-Gray model. X-axes indicate predicted 5- or 10-year probabilities; Y-axes indicate actual observations.