Submit an Article
Navigate
Home
Editorial Board
Editorial Policies
Current Volume
Archive
Scientific Integrity
Publication Ethics Statements
Interviews with Outstanding Authors
Newsroom
Sponsored Conferences
Podcast
Contact
Special Collections
Submit an Article
Online ISSN: 1945-4589
Research Paper
|
Volume 12, Issue 20
|
pp. 20540–20560
Identification of a competing endogenous RNA axis related to gastric cancer
Back to article
Figure 6
(6 of 6)
−
100%
+
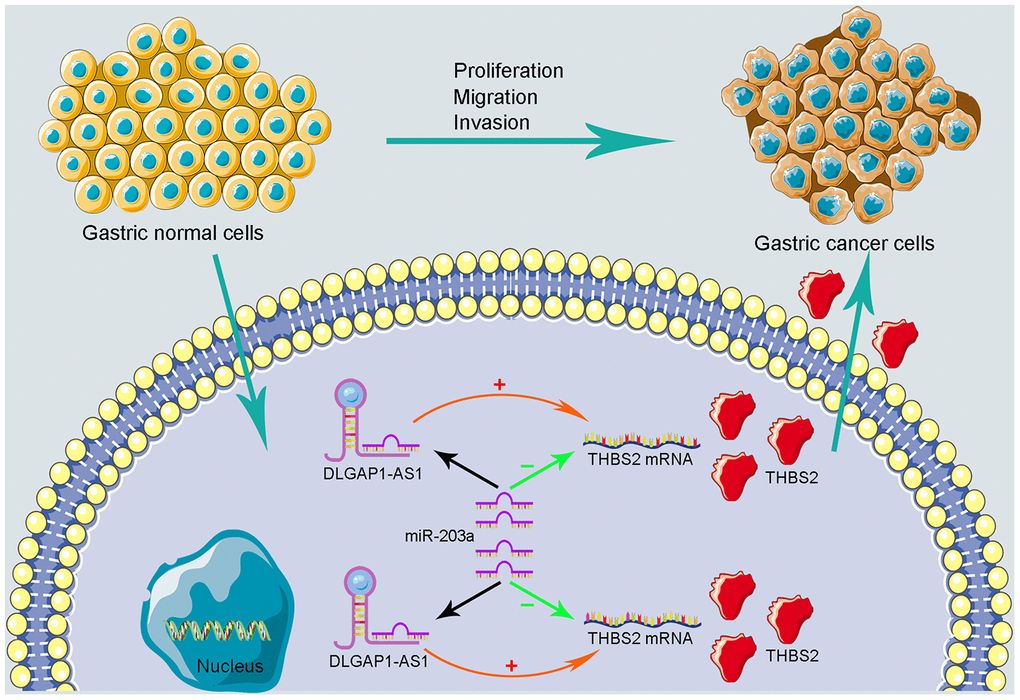
Figure 6.
Schematic representations of DLGAP1-AS1/miR-203a-3p/THBS2 ceRNA pathway and its potential roles in the progression of GC.