Submit an Article
Navigate
Home
Editorial Board
Editorial Policies
Current Volume
Archive
Scientific Integrity
Publication Ethics Statements
Interviews with Outstanding Authors
Newsroom
Sponsored Conferences
Podcast
Contact
Special Collections
Submit an Article
Online ISSN: 1945-4589
Research Paper
|
Volume 12, Issue 21
|
pp. 21481–21503
Two machine learning methods identify a metastasis-related prognostic model that predicts overall survival in medulloblastoma patients
Back to article
Figure 7
(7 of 10)
−
100%
+
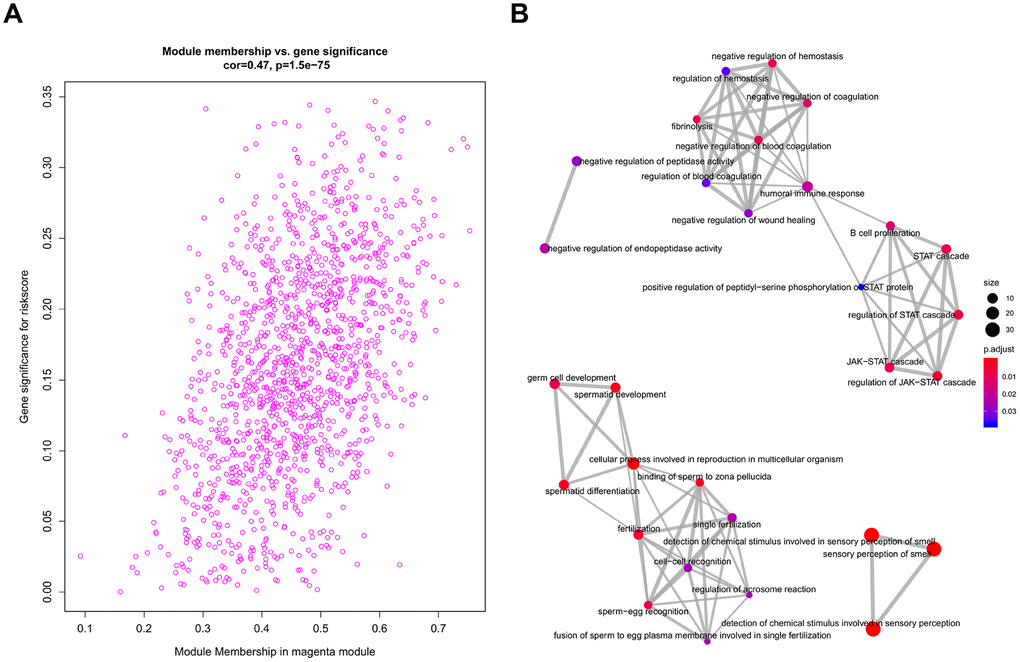
Figure 7.
Functional annotation for magenta module.
(
A
) Scatter plot of module eigengenes associated with risk score in the magenta module. (
B
) GO analysis involved in the co-expression magenta module.