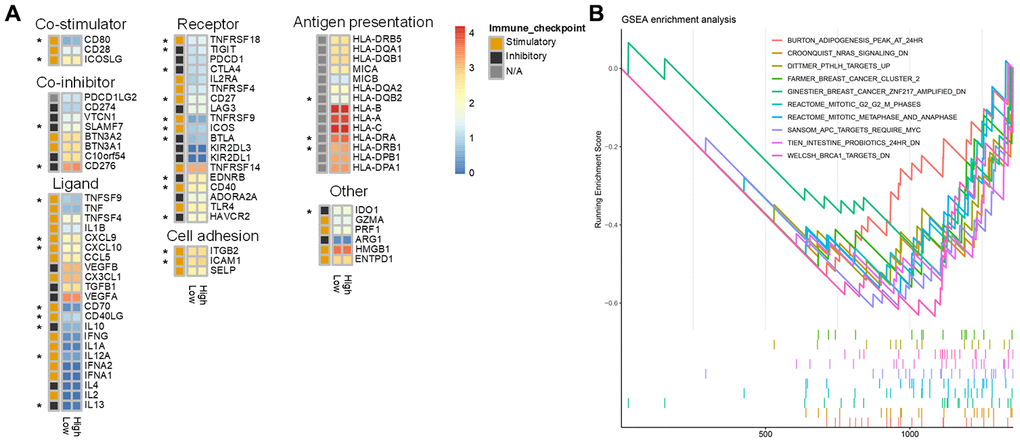
Figure 8.Differences in immune characteristics between the high and low risk score groups. (A) Expression of 75 immunomodulators in the high and low risk groups. “*” indicates a difference in expression between the high and low risk groups. (B) Immune-related GSEA enrichment analysis.