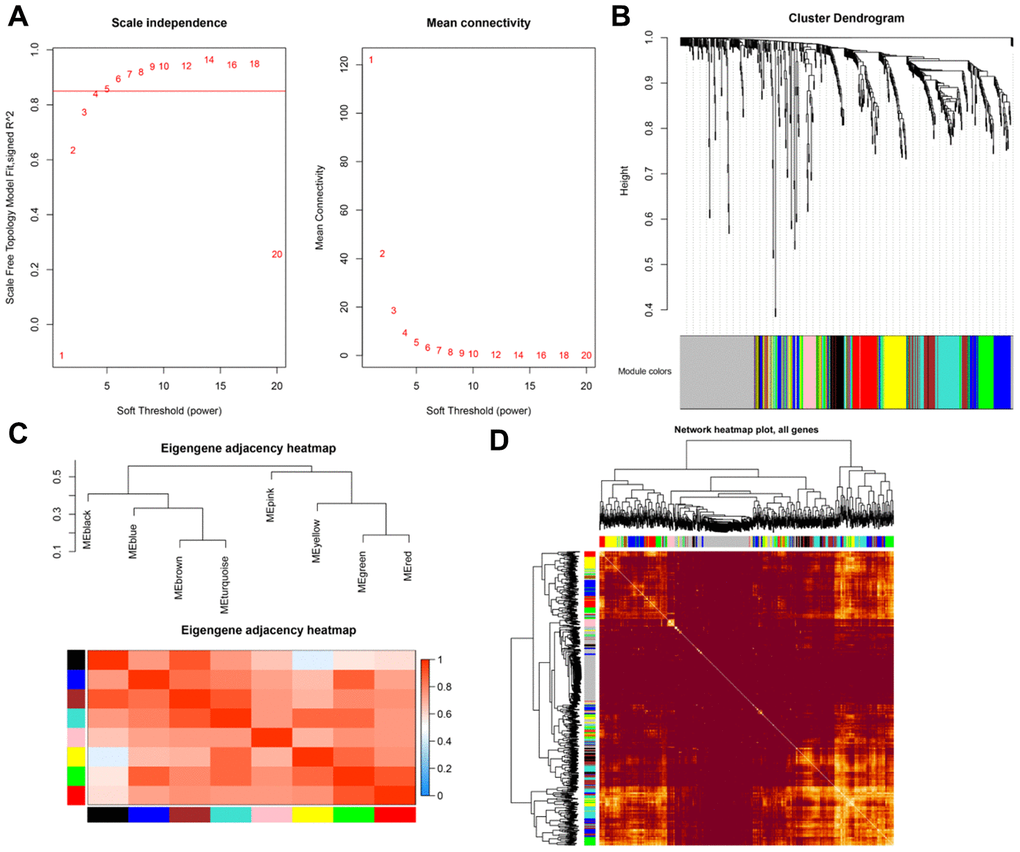
Figure 3.(A) Scale-free fit index for soft-thresholding powers. (B) Dendrogram showing all differentially expressed genes clustered based on different metrics. (C) Heatmap of correlations between module eigengenes and clinical traits. (D) Visualization of gene networks.