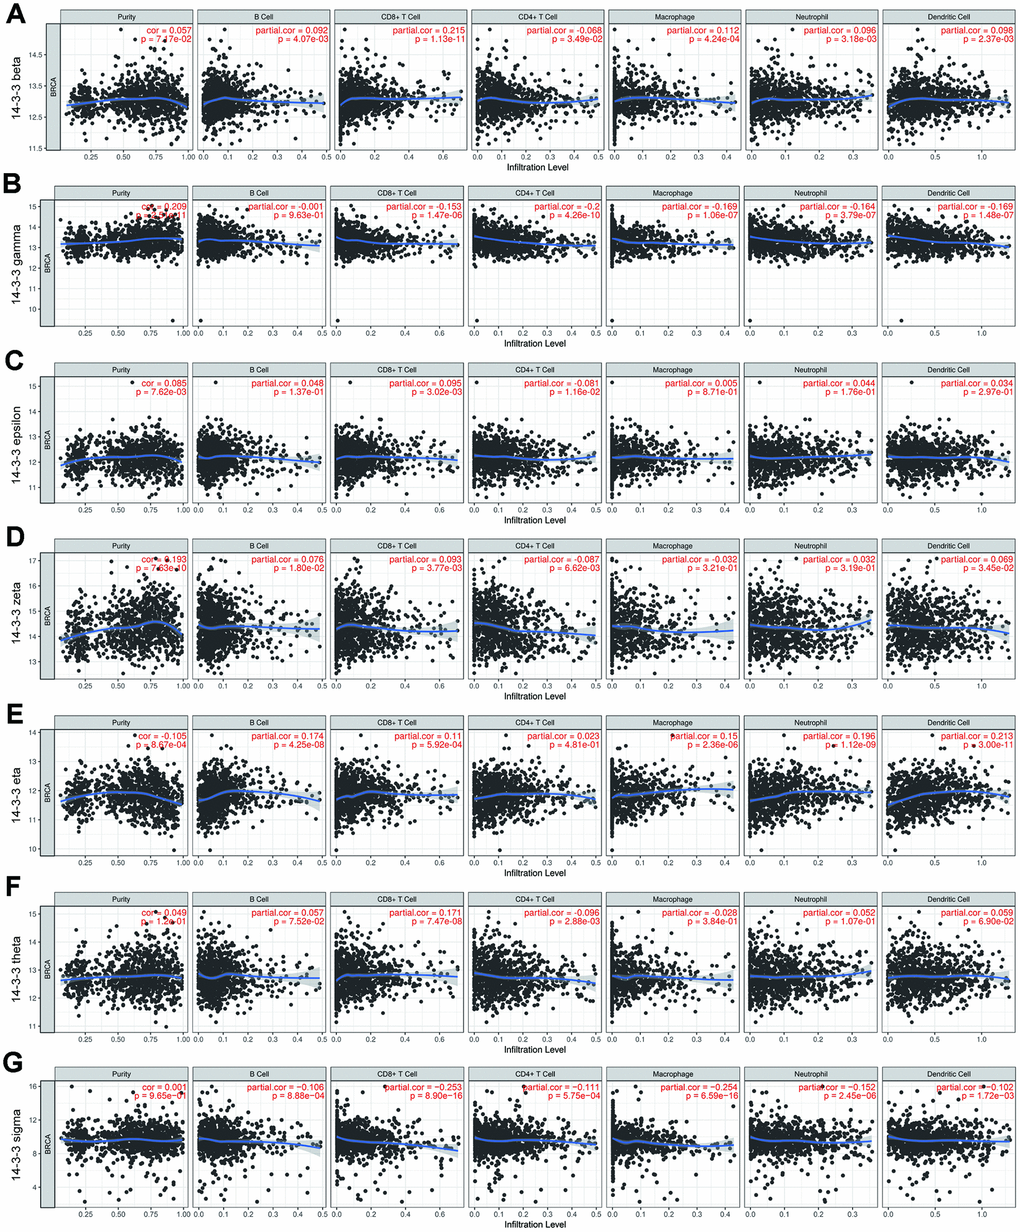
Figure 9.Correlation of TIICs and 14-3-3. Tumor purity is shown in the left panel. The correlation of seven 14-3-3 isoforms and TIICs (B cells, CD4+ T cells, CD8+ T cells, neutrophils, macrophages and dendritic cell types) is displayed. (A) 14-3-3 beta, (B) 14-3-3 gamma, (C) 14-3-3 epsilon, (D) 14-3-3 zeta, (E) 14-3-3 eta, (F) 14-3-3 theta, (G) 14-3-3 sigma.