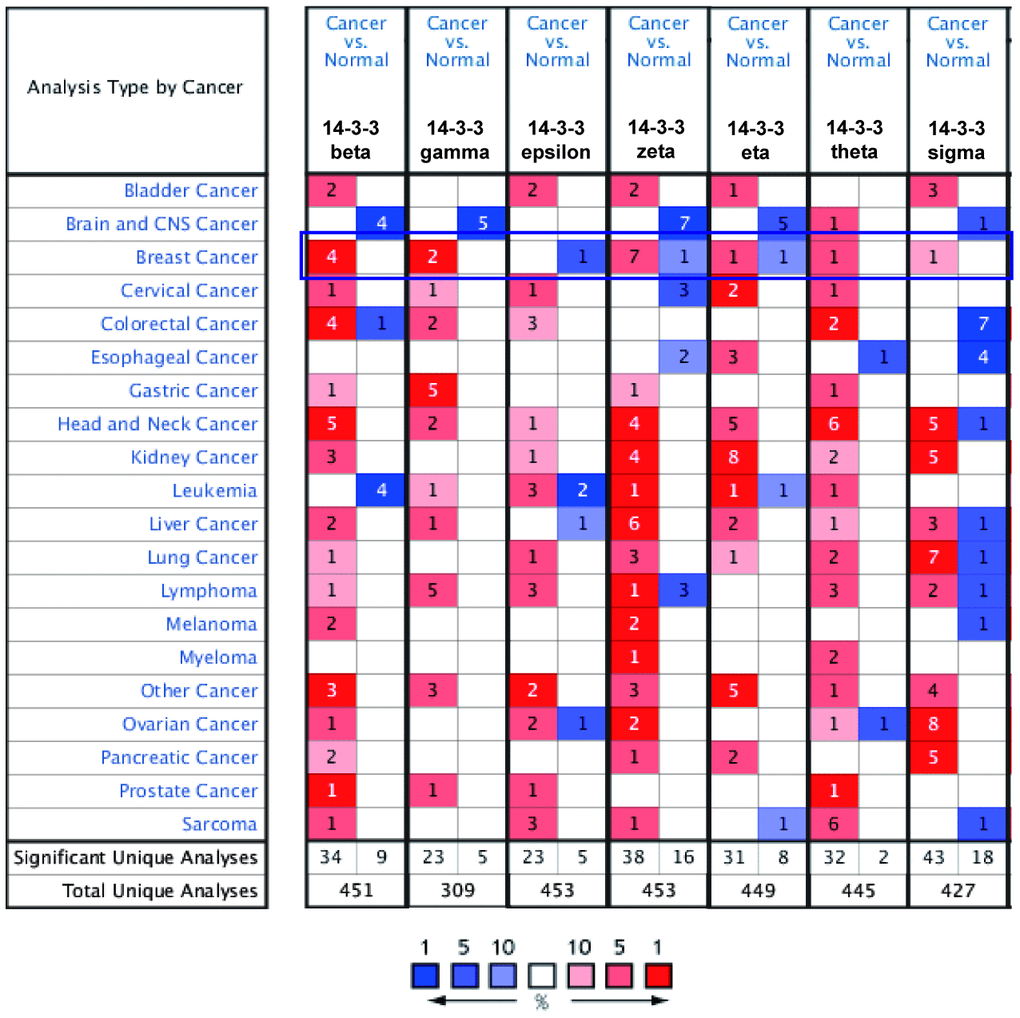
Figure 1.Transcript levels of 14-3-3 in different types of cancer. Dysregulation of 14-3-3 isoforms was observed in various cancers. Threshold settings: p-value: 10e-04; fold change: 1.5; gene rank: top 10%. Red represents upregulation, and blue represents downregulation. The numbers in the colored cell represent the numbers of datasets meeting the thresholds.