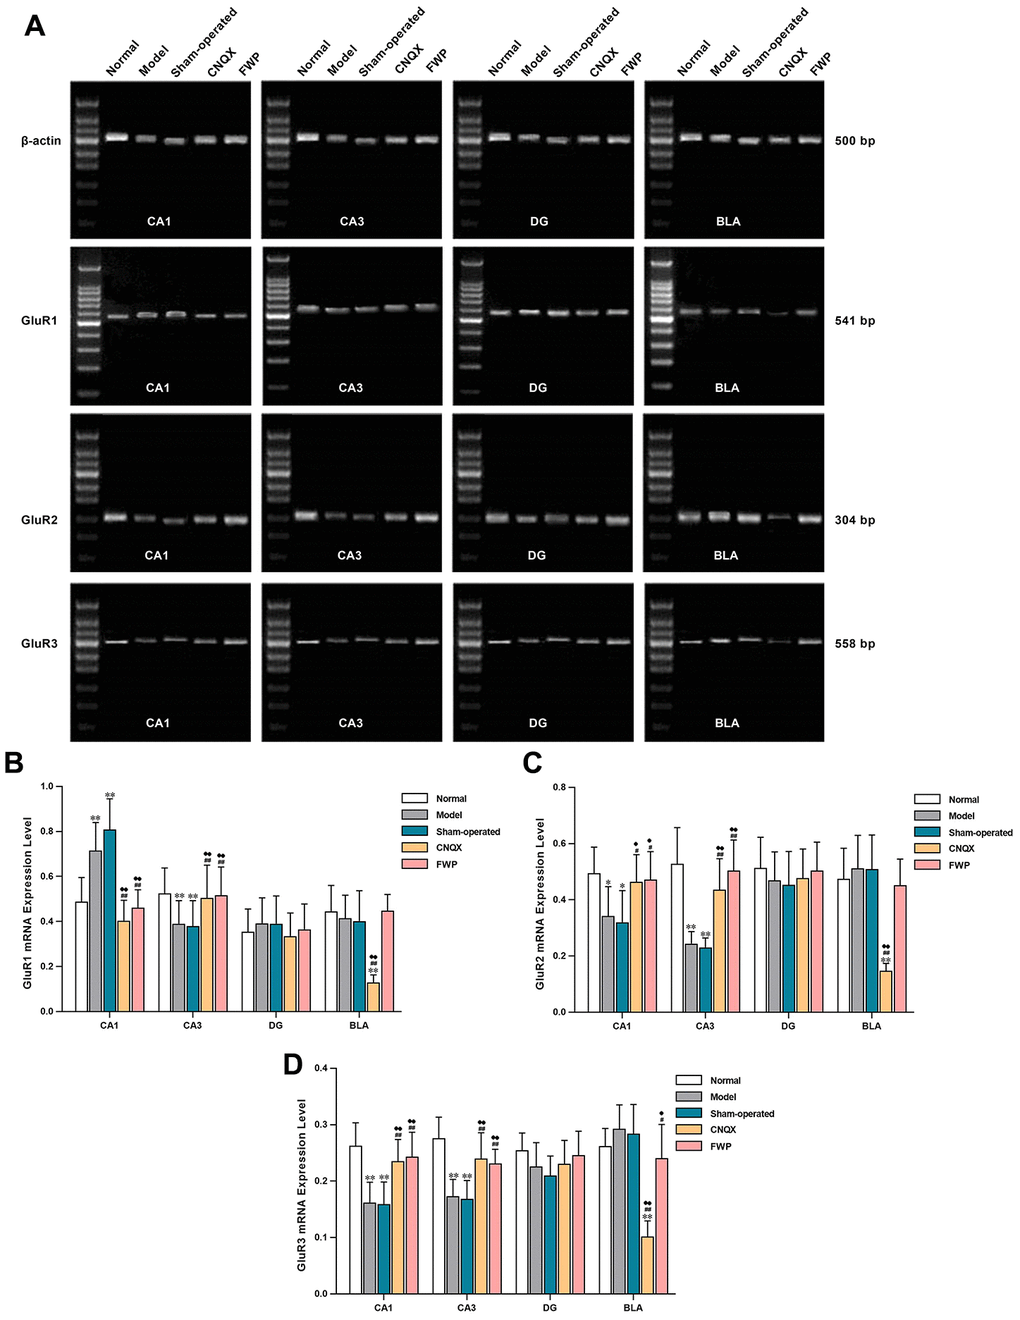
Figure 8.Effects of FWP on gene expression of GluR1, GluR2 and GluR3 in hippocampus and amygdala, in chronic restraint stress induced rat model representing depression with liver-depression and spleen-deficiency syndrome. (A) Electrophoresis of GluR1, GluR2 and GluR3. (B–D) relative quantitation of GluR1, GluR2, and GluR3 (n=5). *P<0.05, **P<0.01 compared with the normal group; #P<0.05, ##P<0.01 compared with the model group; ♦P<0.05, ♦♦P<0.01 compared with the sham-operated group.