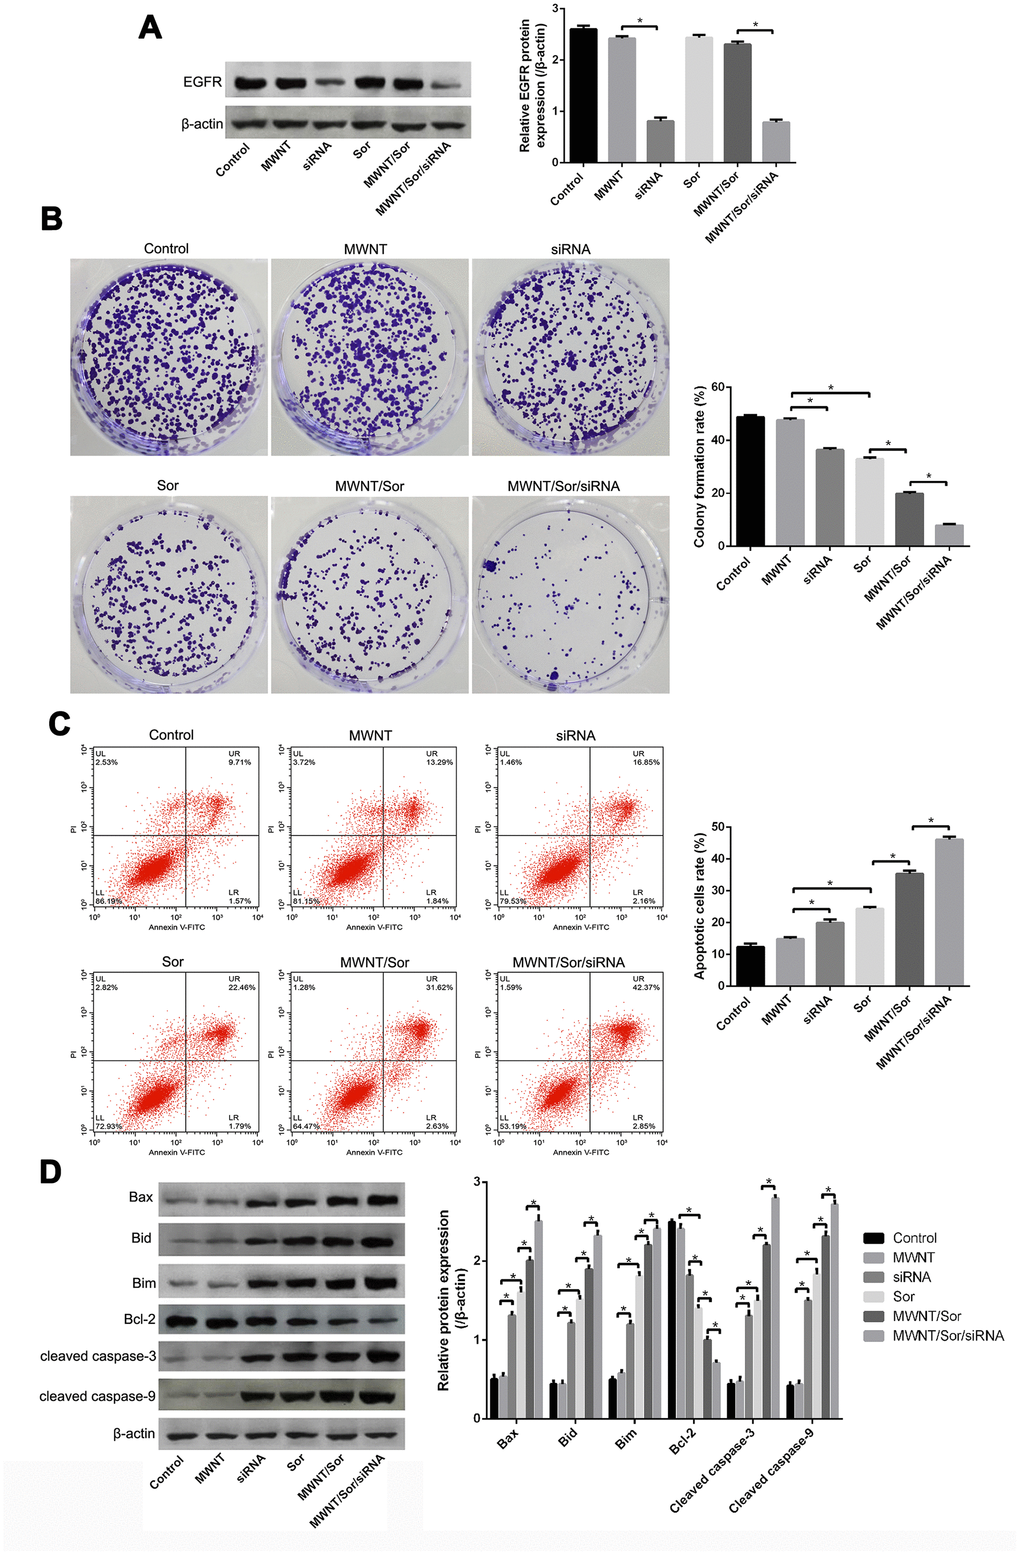
Figure 4.MWNT/Sor/siRNA inhibited growth of HepG2 cells. (A) The protein expression of epidermal growth factor receptor (EGFR) in HepG2 cells treated with PBS (control), MWNTs, siRNA, Sor, MWNT/Sor, or MWNT/Sor/siRNA by western blotting. (B) Colony number of HepG2 cells in control group, MWNTs, siRNA, Sor, MWNT/Sor, or MWNT/Sor/siRNA detected by colony formation assay. (C) Cell apoptosis rate of HepG2 cells in control group, MWNTs, siRNA, Sor, MWNT/Sor, or MWNT/Sor/siRNA tested by flow cytometry assay. (D) The proteins expression including Bax, Bid, Bim, cleaved caspase-3, and cleaved caspase-9, in HepG2 cells in control group, MWNTs, siRNA, Sor, MWNT/Sor, or MWNT/Sor/siRNA measured by western blot. *P < 0.05.