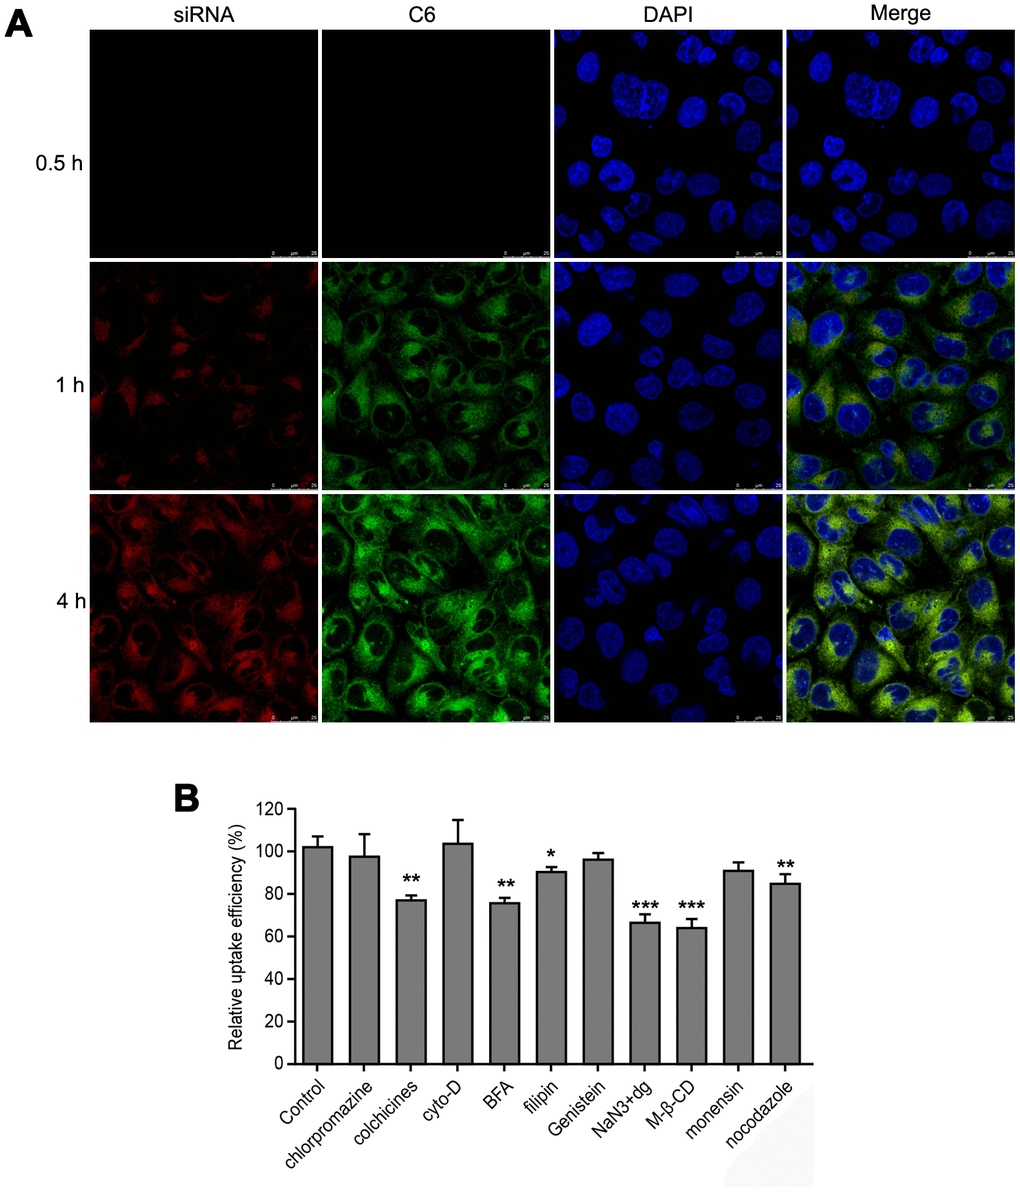
Figure 3.Cellular uptake of MWNT/Sor/siRNA by HepG2 cells. (A) Confocal images of HepG2 cells treated with for 0.5, 1 and 4 h, respectively. (B) The relative uptake efficiency of MWNT/C6/siRNA after HepG2 cells treated with different inhibitors. *P < 0.05, **P < 0.01, ***P < 0.001 compared to control.