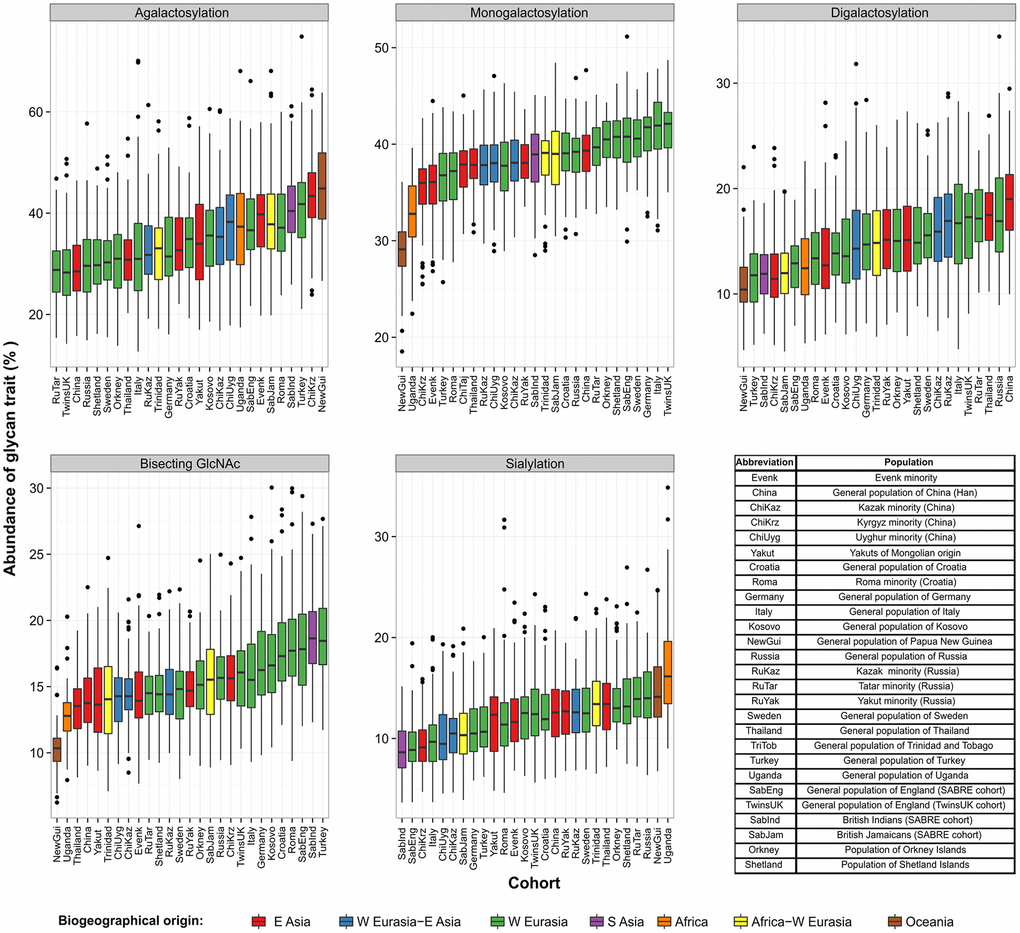
Figure 2.Levels of derived IgG1 Fc glycan traits across 27 different populations collected worldwide. Each box represents interquartile range (25th to 75th percentiles) with median values drawn as the middle line. Whiskers outside the boxes represent the 10th and 90th percentiles, while dots indicate outliers.