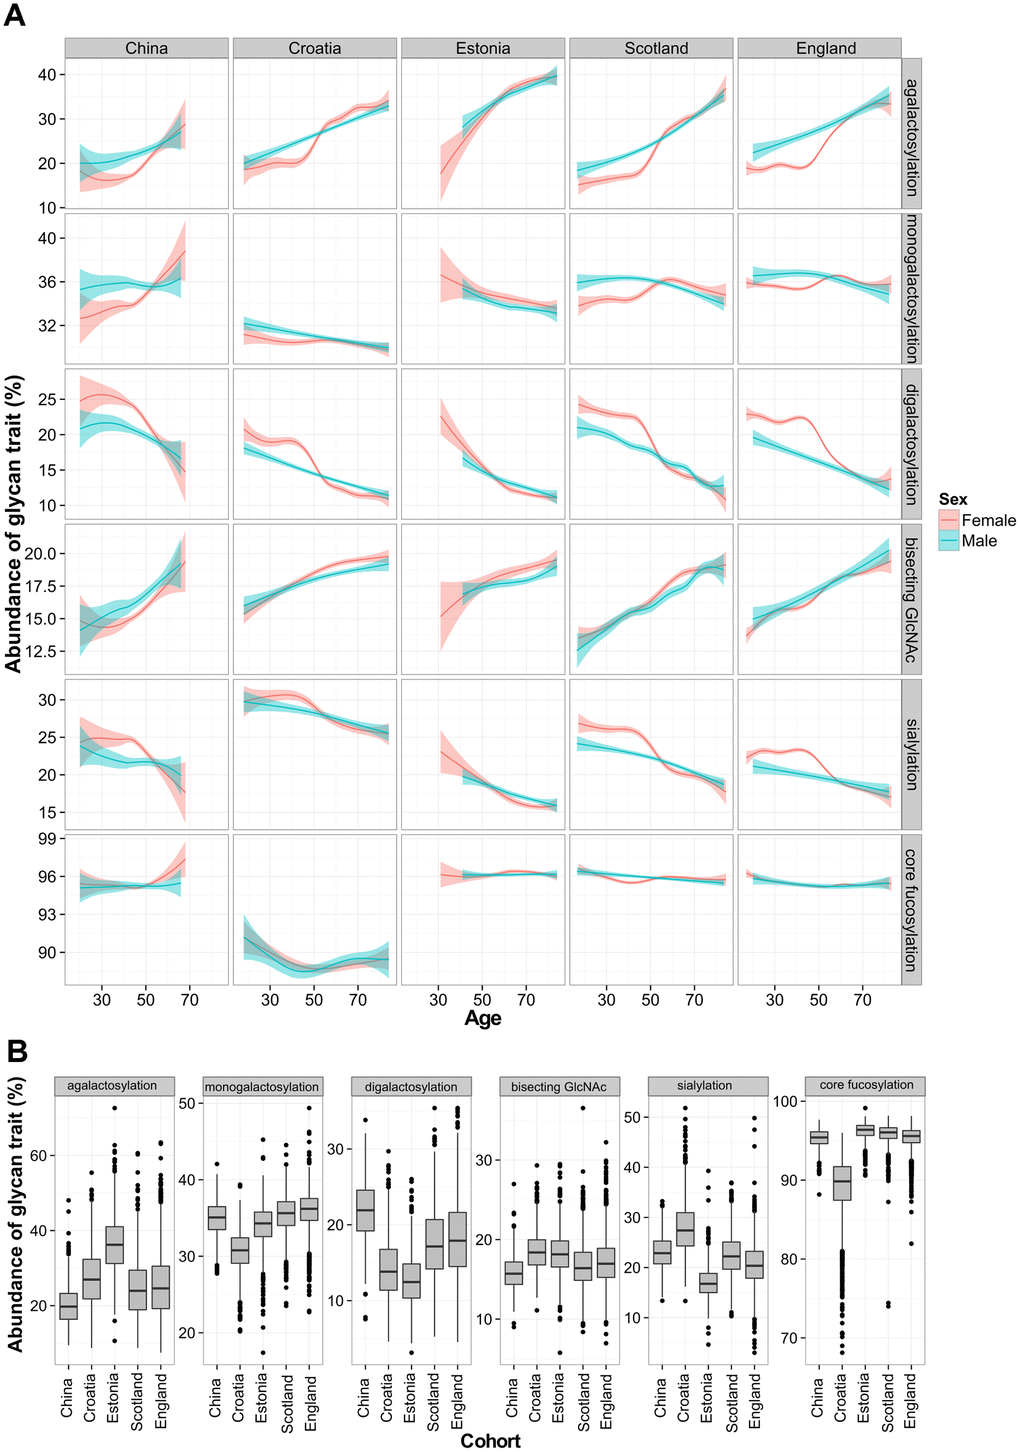
Figure 1.Total IgG glycan levels in five different populations. Relationship between age and derived glycan trait (A). Plots describe associations between each of the five glycan traits and chronological age of participant. Blue and red curves represent fitted linear regression models. The shaded region is the 95 % confidence interval on the fitted values. Differences in total IgG glycosylation between participants from five different populations (B). Each box represents interquartile range (25th to 75th percentiles). Lines inside the boxes represent the median values, while lines outside the boxes represent the 10th and 90th percentiles. Dots indicate outliers.