Submit an Article
Navigate
Home
Editorial Board
Editorial Policies
Current Volume
Archive
Scientific Integrity
Publication Ethics Statements
Interviews with Outstanding Authors
Newsroom
Sponsored Conferences
Podcast
Contact
Special Collections
Submit an Article
Online ISSN: 1945-4589
Research Paper
|
Volume 12, Issue 20
|
pp. 20483–20492
Accelerated telomere shortening independent of LRRK2 variants in Chinese patients with Parkinson's disease
Back to article
Figure 1
(1 of 2)
−
100%
+
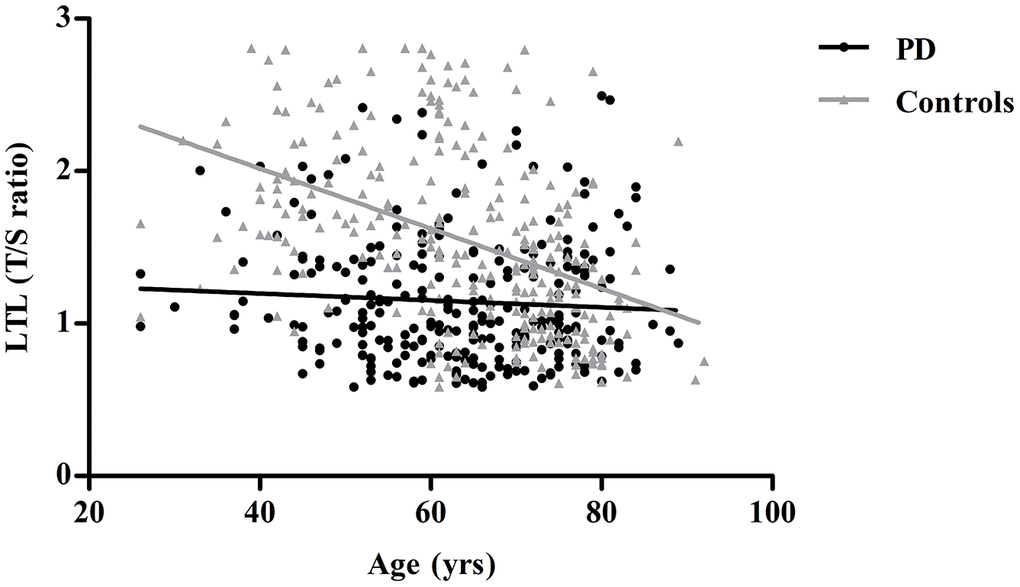
Figure 1.
Linear regression analysis of the association between leukocyte telomere length (LTL) and age in controls and PD patients.
Controls are shown as gray triangles (n=270) and PD patients as black dots (n=261).