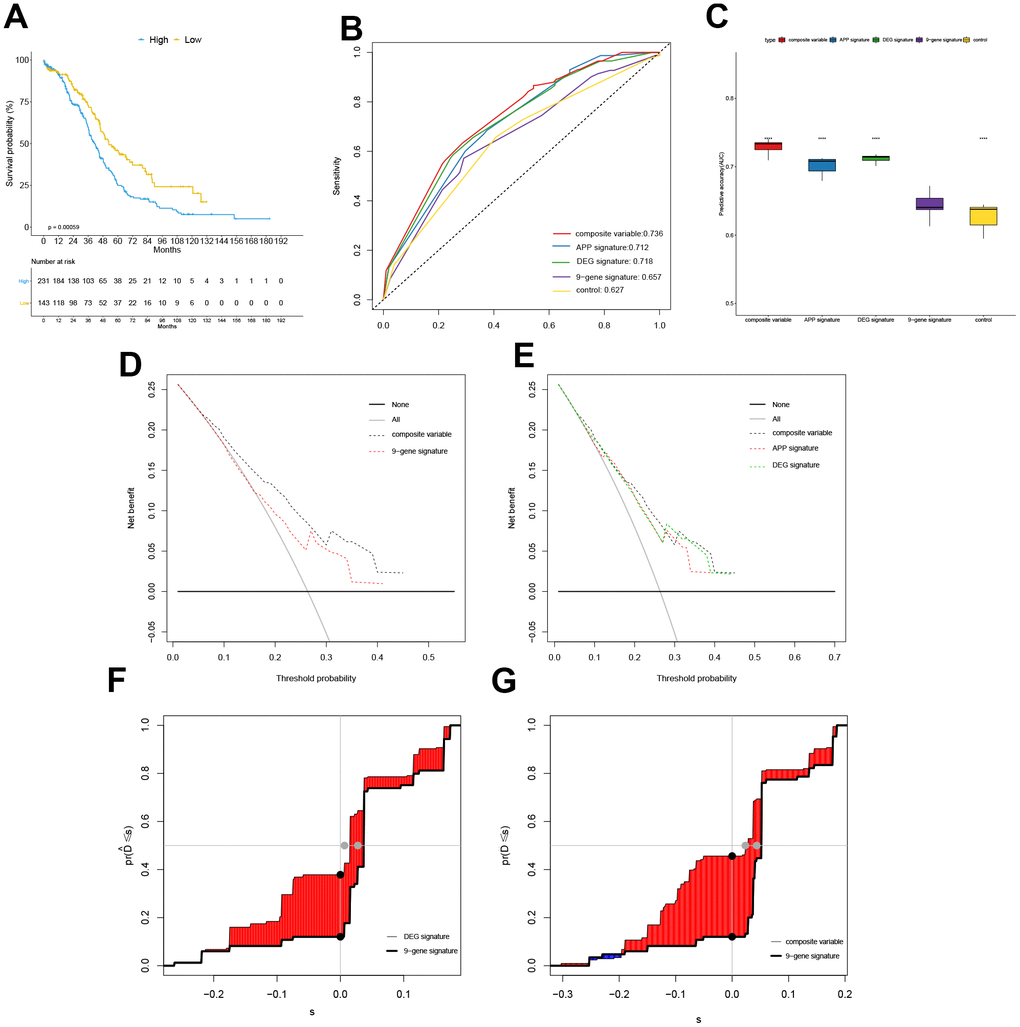
Figure 4.Comparison with previously published gene signatures. The Kaplan-Meier curve grouped by 9-gene signature in training cohort (A), the time-dependent ROC at 30 months in the TCGA cohort (B), the box plot for comparing AUC values of different models ("****" means P value <0.0001) (C), Decision Curve Analysis (DCA) (D–E), and the plot of Integrated Discrimination Improvement (IDI) (F–G).