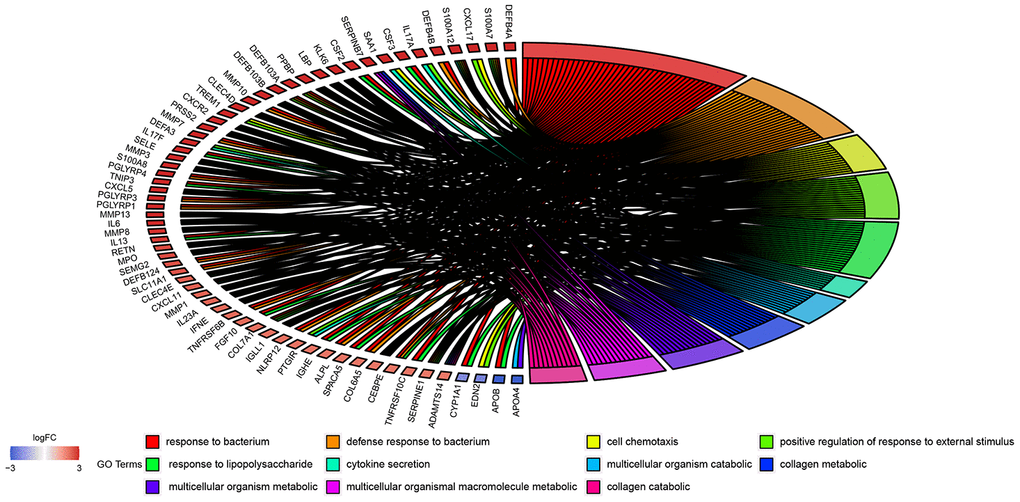
Figure 4.GO enrichment analysis of 908 DEGs. Genes are listed at the left side. Up-regulated genes are in red color, and down-regulated genes are in blue color conversely. The ligated bands between left and right side indicate that DEGs are related to the GO terms.