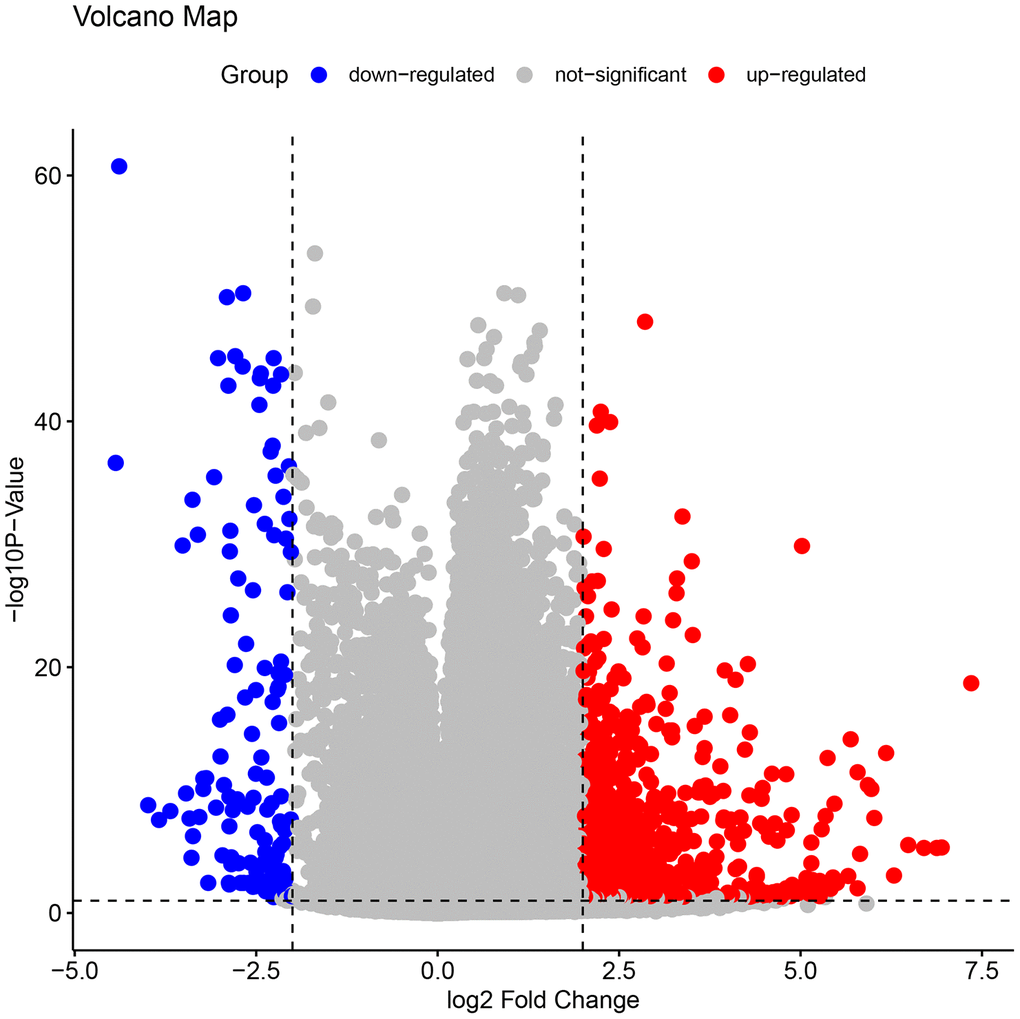
Figure 2.The volcano plots of all the DEGs in GSE109142. In the map, each blue spot represents a down-regulated gene, whereas each red spot represents an up-regulated gene. A clear demarcation can be identified between up-regulated genes and down-regulated genes.