Submit an Article
Navigate
Home
Editorial Board
Editorial Policies
Current Volume
Archive
Scientific Integrity
Publication Ethics Statements
Interviews with Outstanding Authors
Newsroom
Sponsored Conferences
Podcast
Contact
Special Collections
Submit an Article
Online ISSN: 1945-4589
Research Paper
|
Volume 12, Issue 19
|
pp. 19440–19454
Weighted gene coexpression network analysis identifies the key role associated with acute coronary syndrome
Back to article
Figure 4
(4 of 7)
−
100%
+
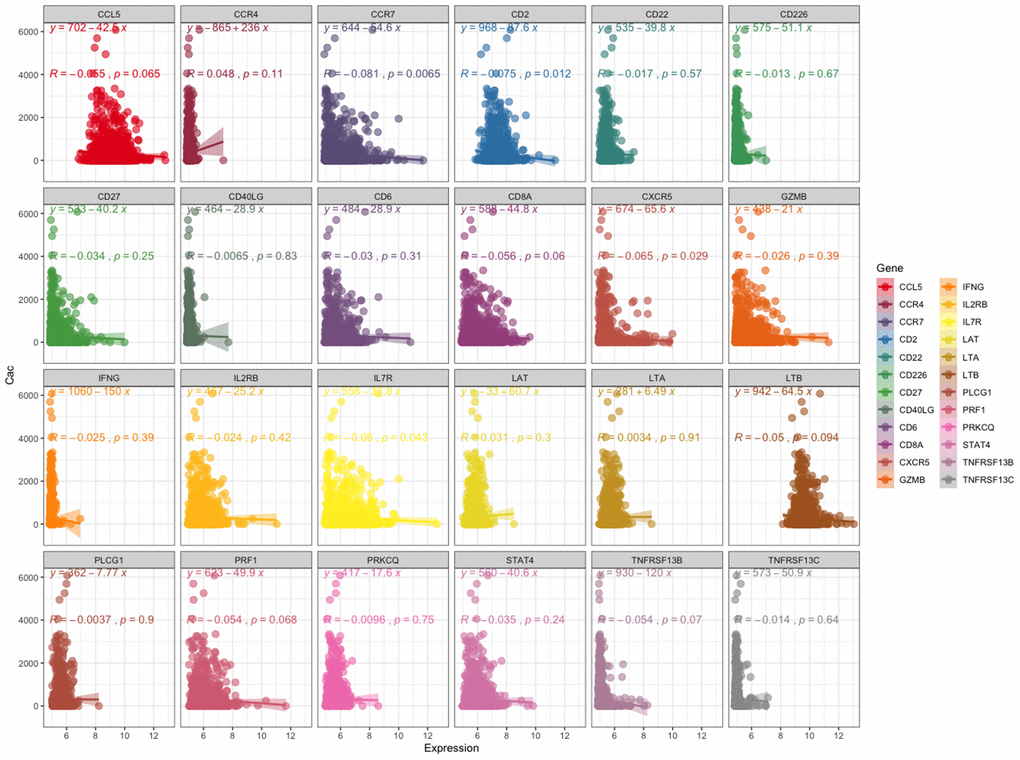
Figure 4.
Relationship between the expression level of these 24 genes and coronary artery calcification score.
The left panel shows the coronary artery calcification score (y-axis). The expression level of these 24 genes is shown on the x-axis.