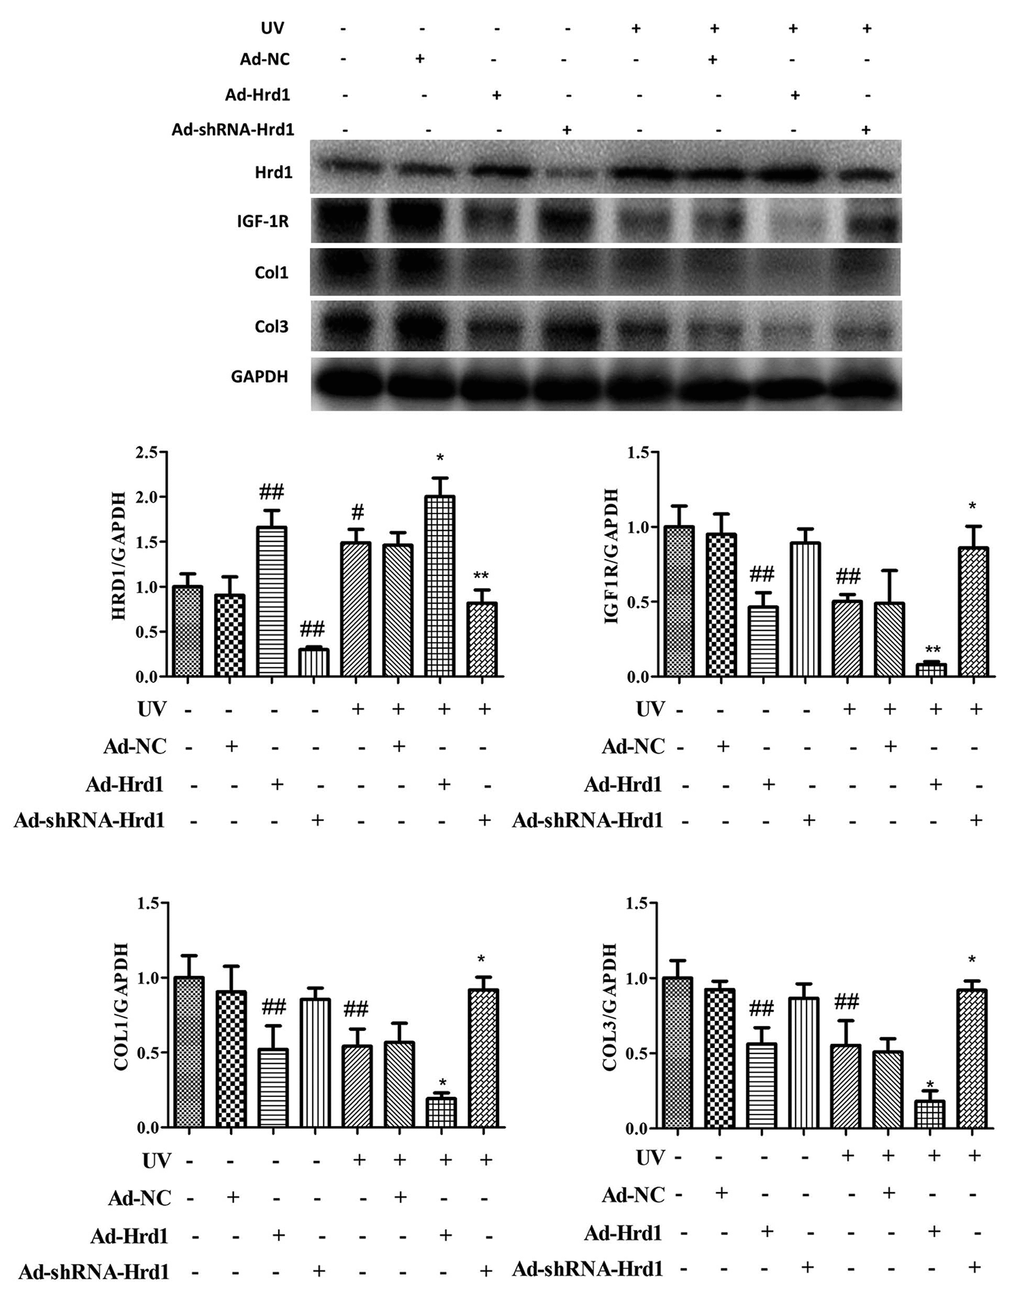
Figure 6.The effect of Hrd1 transfection on the protein expressions of Hrd1, IGF-1R, Type I collagen and Type III collagen by western blot in HSF cells. The results were presented as mean ± SD. #< 0.05, ##< 0.01 compared with control group. *P < 0.05, **P < 0.01 compared with UV group.