Submit an Article
Navigate
Home
Editorial Board
Editorial Policies
Current Volume
Archive
Scientific Integrity
Publication Ethics Statements
Interviews with Outstanding Authors
Newsroom
Sponsored Conferences
Podcast
Contact
Special Collections
Submit an Article
Online ISSN: 1945-4589
Research Paper
|
Volume 12, Issue 19
|
pp. 19399–19420
Comprehensive analysis of TGF-β-induced mRNAs and ncRNAs in hepatocellular carcinoma
Back to article
Figure 4
(4 of 8)
−
100%
+
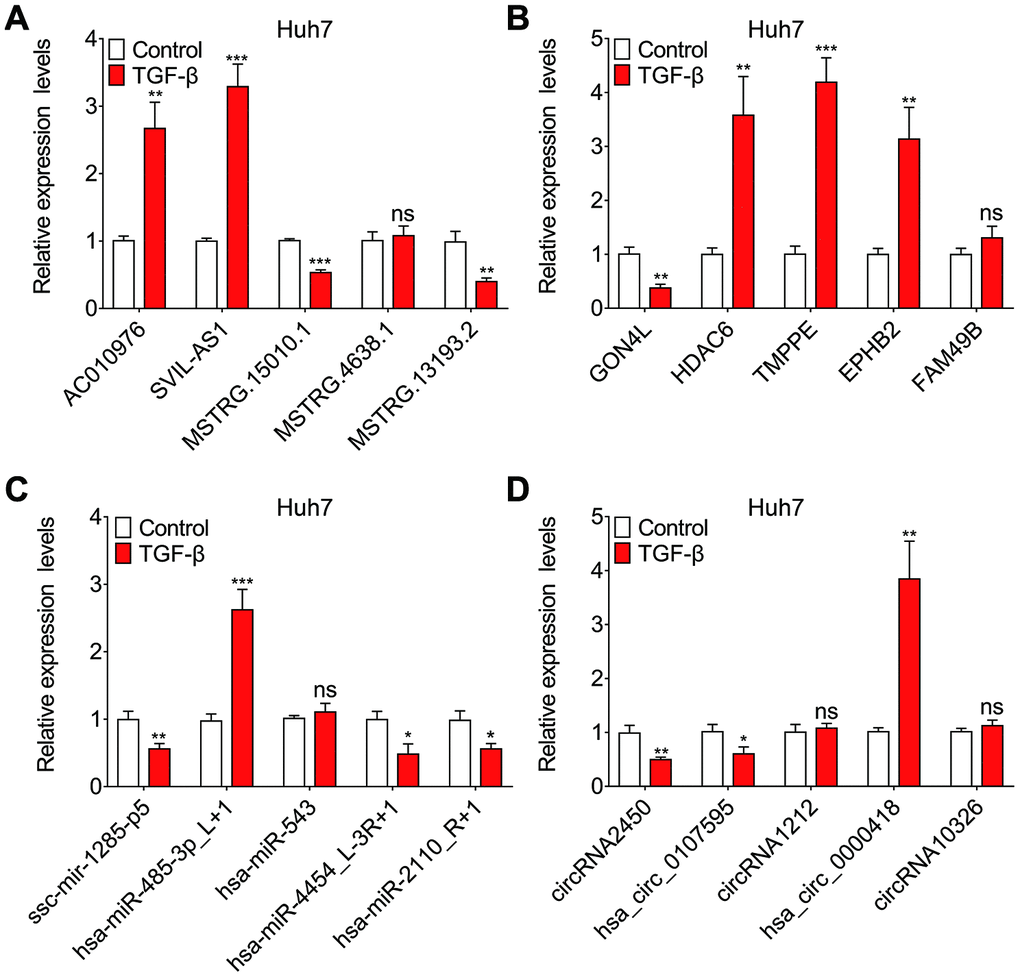
Figure 4.
Validation of sequencing data using qRT-PCR.
Relative expression levels of five randomly selected lncRNAs (
A
), mRNAs (
B
), miRNAs (
C
) and circRNAs (
D
), assessed by qRT-PCR.