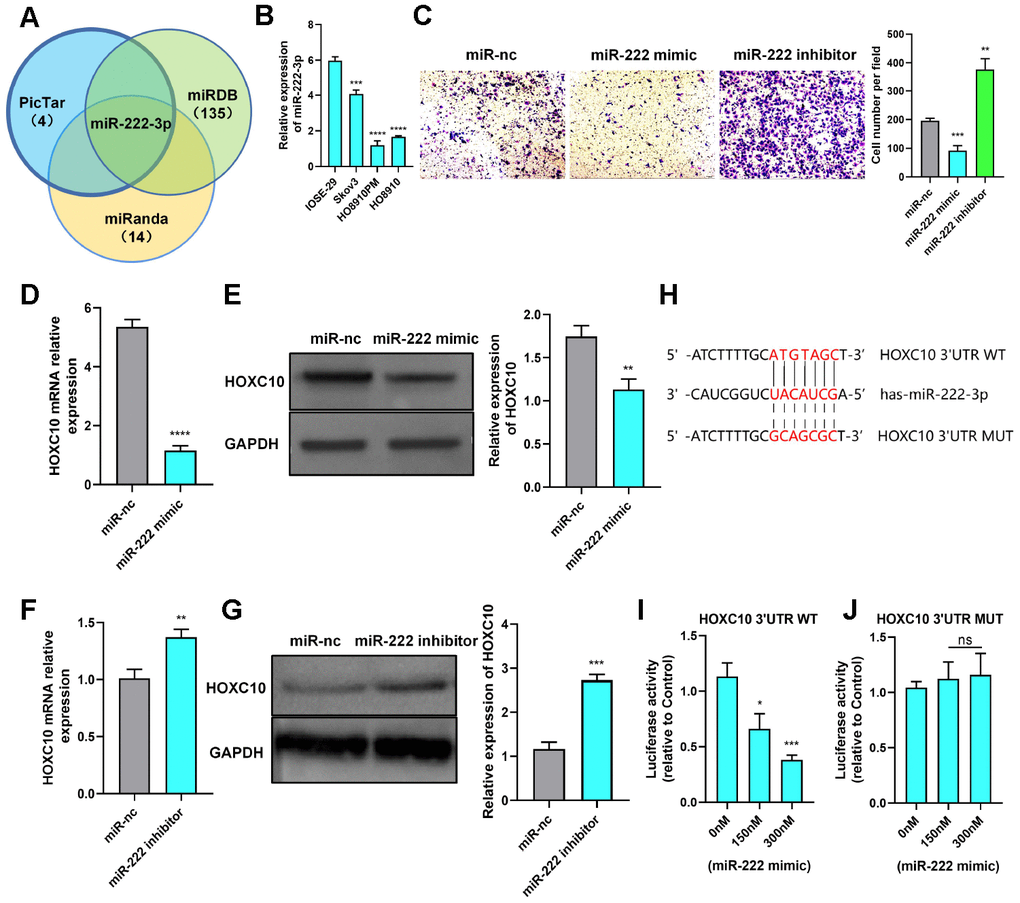
Figure 4.HOXC10 expression is regulated by miR-222-3p. (A) A Venn diagram was used to identify the candidate miRNAs targeting HOXC10. (B) Relative expression of miR-222-3p in cell lines. P=0.0004, P<0.0001, and P<0.0001. (C) Transwell assay of PM cells transfected with the miR-222-3p mimic, miR-222-3p inhibitor or negative control. P=0.0007 and P=0.0012. Scale bars, 100 μm. (D, E) Relative mRNA and protein expression levels of HOXC10 in PM cells transfected with the miR-222-3p mimic or negative control. P<0.0001 and P=0.0037. (F, G) Relative mRNA and protein expression levels of HOXC10 in Skov3 cells transfected with the miR-222-3p inhibitor or negative control. P=0.0041 and P=0.0002. (H) Schematic diagram of the binding site for miR-222-3p in the HOXC10 3’UTR. (I) PM cells were cotransfected with a plasmid containing the full-length HOXC10 3’UTR and increasing concentrations of the miR-222-3p mimic. P=0.0108 and P=0.0005. (J) PM cells were cotransfected with a plasmid containing the mutated full-length HOXC10 3’UTR and increasing concentrations of the miR-222-3p mimic. P=0.4474 and P=0.3730.
(K, L) Rescue experiment with 8910 cells cotransfected with the miR-222-3p mimic, HOXC10 overexpression plasmid, miR negative control or empty vector. P=0.0002, P<0.0001, and P=0.4823; P=0.0017, P=0.0010, and P=0.7193. Scale bars, 200 μm and 100 μm, respectively. (M, N) Rescue experiment with 8910 cells cotransfected with the miR-222-3p inhibitor, siRNA targeting HOXC10, miR negative control or siRNA negative control. P<0.0001, P=0.0001, and P=0.3069; P=0.0003, P=0.0042, and P=0.3539. Scale bars, 200 μm and 100 μm, respectively.