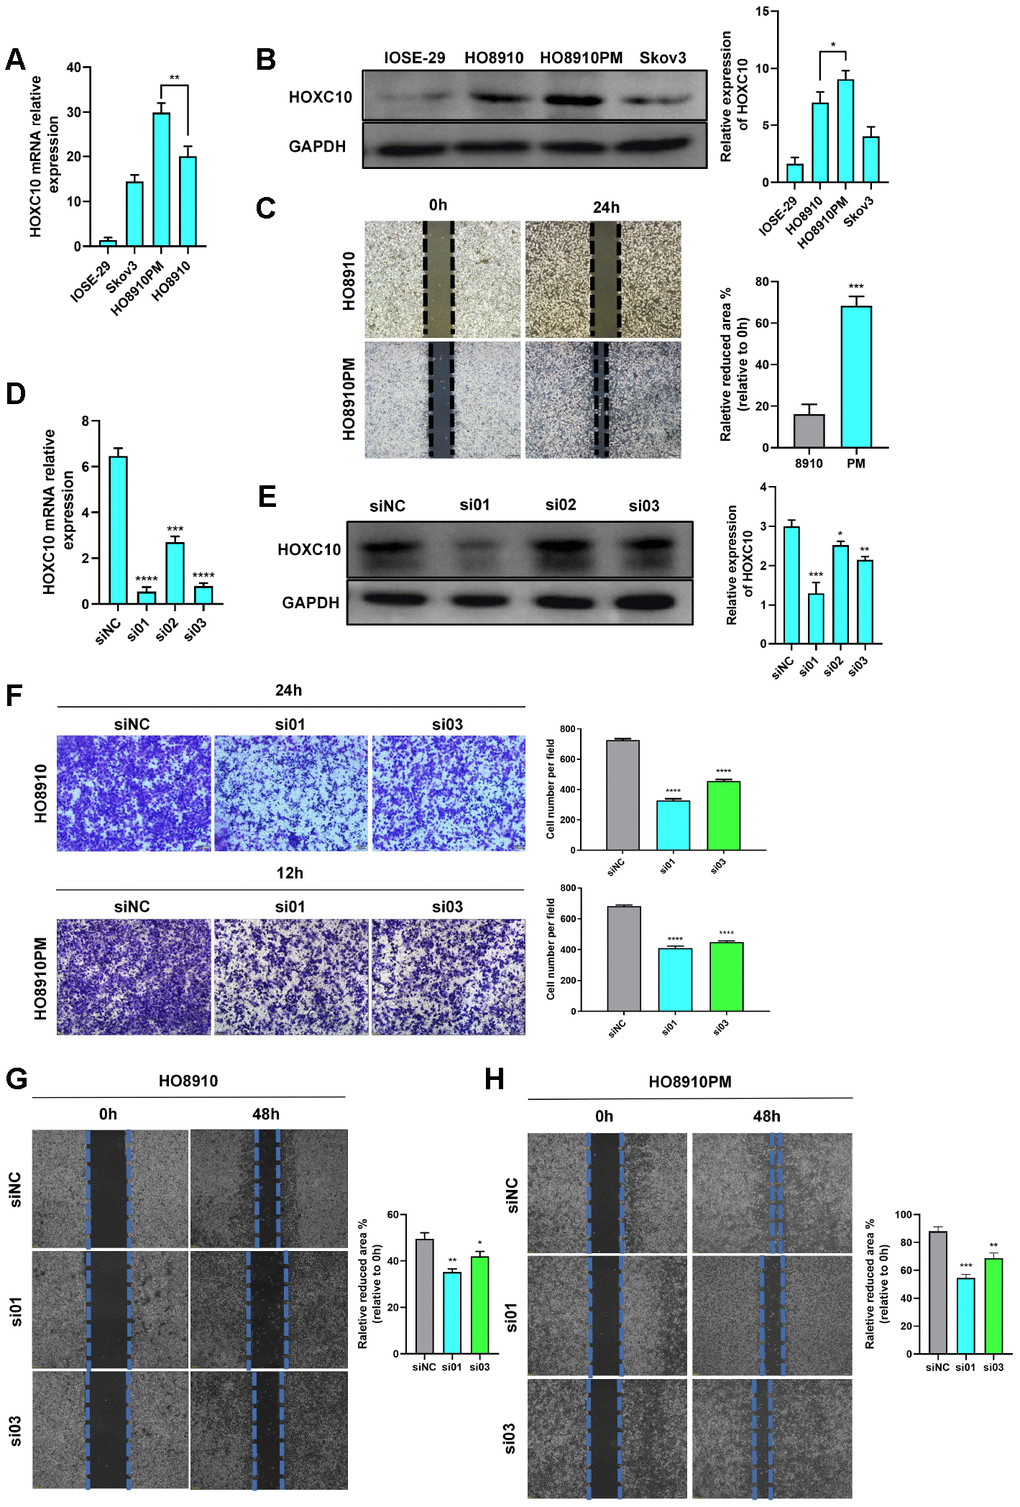
Figure 2.HOXC10 accelerates OC cell migration. (A, B) Relative mRNA and protein expression levels of HOXC10. 8910 vs. PM cells. P=0.0177 (mRNA), P=0.0301 (protein). (C) Comparison of the migration ability of 8910 and PM cells via wound healing assays. P=0.0002. Scale bars, 200 μm. (D, E) Transfection efficiencies of the HOXC10 siRNA products. P<0.0001, P=0.0001 and P<0.0001; P=0.0008, P=0.0120 and P=0.0013. (F) Transwell assay of 8910 and PM cells transfected with HOXC10 siRNA products No. 1 and No. 3 and the negative control siRNA. 8910 cell graphs, P<0.0001 and P<0.0001. PM cell graphs, P<0.0001 and P<0.0001. Scale bars, 100 μm. (G, H) Wound healing assay of 8910 and PM cells transfected with HOXC10 siRNA products No. 1 and No. 3 and the negative control siRNA. P=0.0010 and P=0.0167; P=0.0025 and P=0.0097. Scale bars, 200 μm.
(I, J) Relative mRNA and protein expression levels of HOXC10 in 8910 cells transfected with the HOXC10 overexpression plasmid and empty vector. P<0.0001, P=0.0003. (K, L) Transwell and wound healing assays of Skov3 cells transfected with the HOXC10 overexpression plasmid and empty vector. P=0.0003, P<0.0001. Scale bars, 100 μm and 200 μm, respectively. (M) Fluorescence signal in 8910 cells transfected with the HOXC10 overexpression plasmid, HOXC10 NLS mutation plasmid and empty vector; all cells were stained with DAPI. Scale bars, 25 μm. (N, O) Transwell and wound healing assays of 8910 cells transfected with the HOXC10 overexpression plasmid, HOXC10 NLS mutation plasmid and empty vector. P=0.0005 and P=0.2381; P<0.0001 and P=0.0827. Scale bars, 100 μm and 200 μm, respectively.