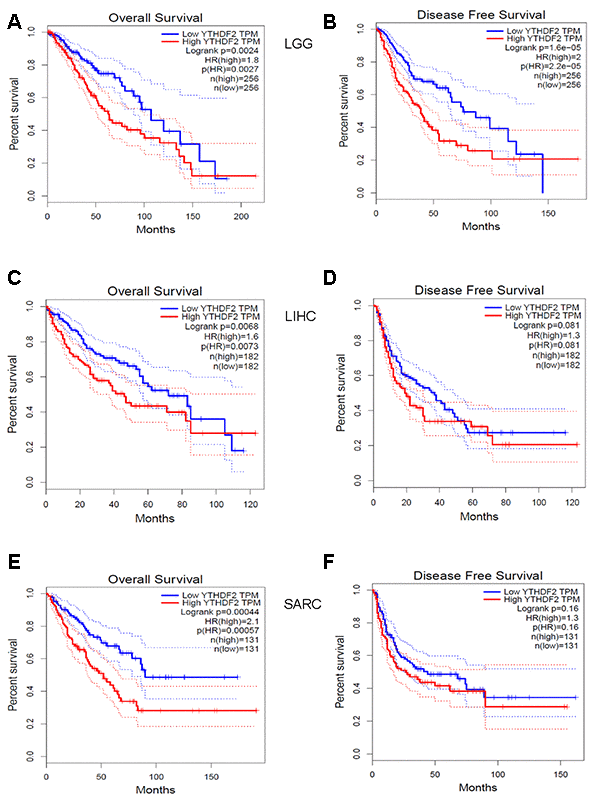
Figure 2.Kaplan-Meier survival curves comparing YTHDF2 high and low expression (A, B) in LGG, (C, D) LIHC, and (E, F) SARC in datasets from the GEPIA database. (A) OS and (B) DFS survival curves in LGG (n = 256). (C) OS and (D) DFS survival curves in LIHC (n = 182). (E) OS and (F) DFS survival curves in SARC (n = 131). DFS, disease-free survival; LGG, lower-grade glioma; LIHC, liver hepatocellular carcinoma; SARC, sarcoma; OS, overall survival.