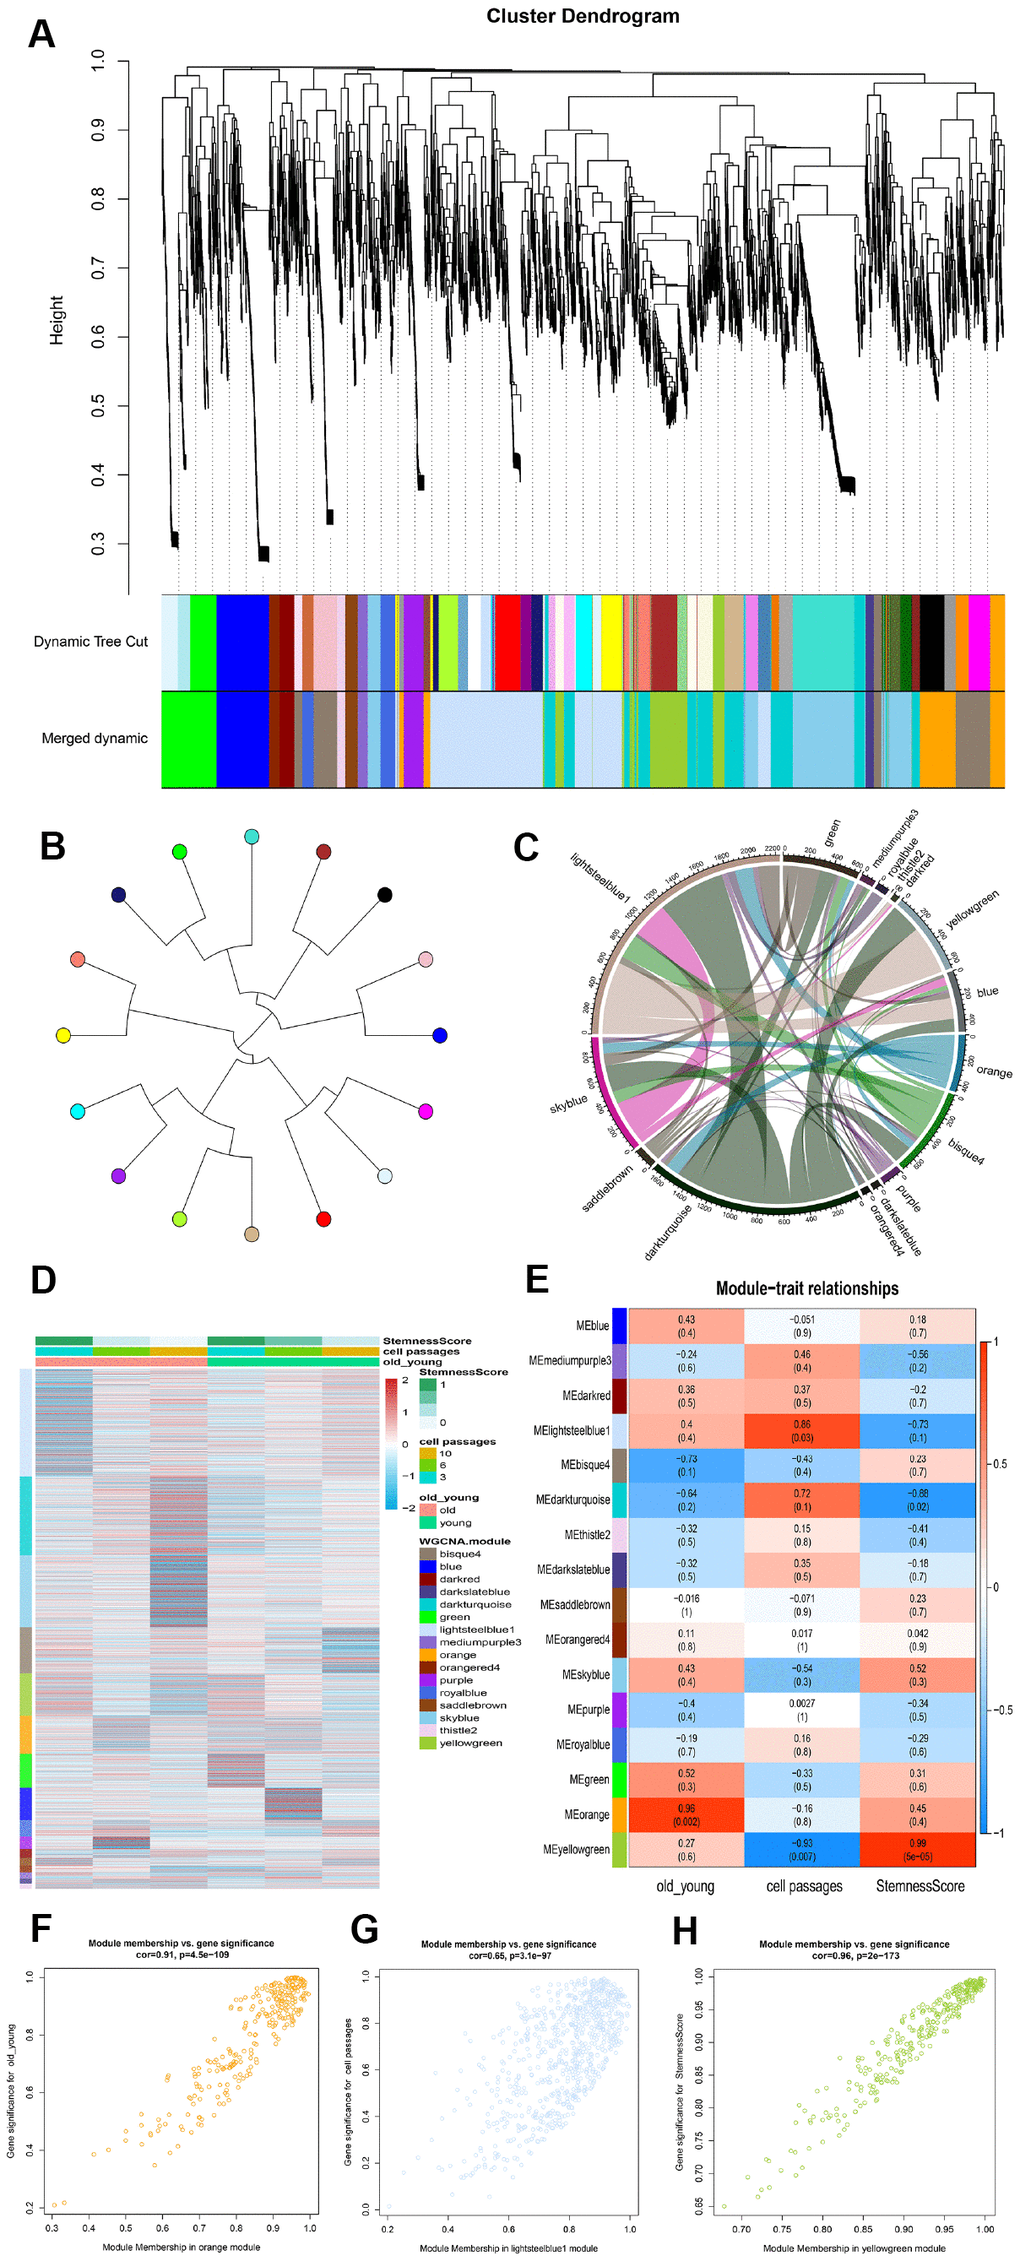
Figure 3.Identification of modules that was significantly correlated with phenotype. (A) Clustering dendrogram and modules. Each gene is represented by a leaf in the tree, where the y-axis represents the network distance determined by the topological overlap (TO) and different colors indicate the combined module membership. A total of 16 modules were identified. (B) Module tree diagram. Each point represents a module, and the lines indicate the interaction between the modules. (C) Circplot between modules. (D) Cluster analysis heatmap showing the expression of different modules in different phenotypes. (E) A heatmap of the correlation between module eigengenes and ADSCs phenotype. (F–H) The scatter plot shows the correlation between different phenotypes and MEorange, MElightsteelblue1 and MEyellowgreen.