Submit an Article
Navigate
Home
Editorial Board
Editorial Policies
Current Volume
Archive
Scientific Integrity
Publication Ethics Statements
Interviews with Outstanding Authors
Newsroom
Sponsored Conferences
Podcast
Contact
Special Collections
Submit an Article
Online ISSN: 1945-4589
Review
|
Volume 12, Issue 15
|
pp. 15856–15874
Pompe disease: pathogenesis, molecular genetics and diagnosis
Back to article
Figure 2
(2 of 4)
−
100%
+
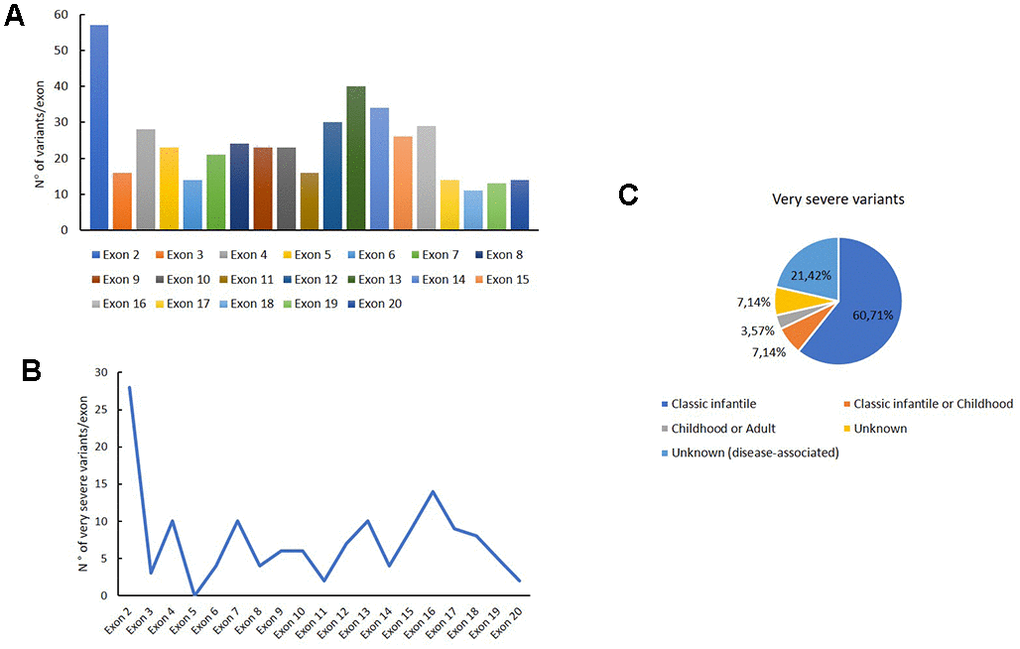
Figure 2.
Genetic variants distribution into
GAA
exons.
Distribution of variants for each exon (
A
); distribution of very severe variants for each exon (
B
); association of the very severe variants with PD phenotypes.
Figure 2 — Pompe disease: pathogenesis, molecular genetics and diagnosis | Aging