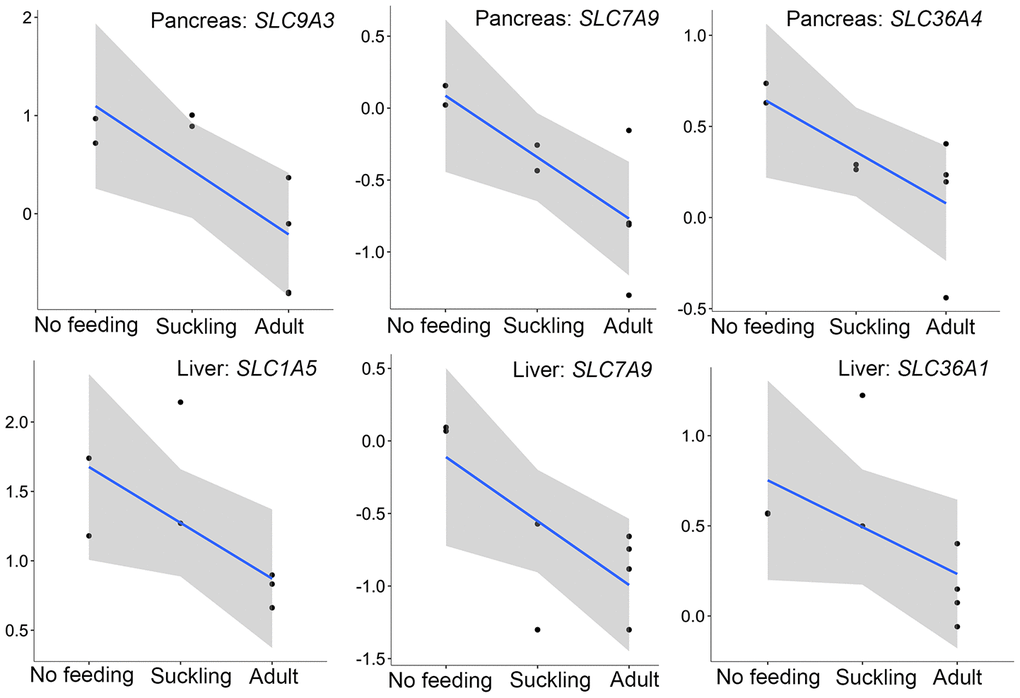
Figure 8.The expression patterns of SLC family genes involved in amino acid transport in the pancreas and liver. The vertical axis indicates the log10-transformed normalized CPM expression values. The gray shadow represents the 95% confidence field of the fitted curve.