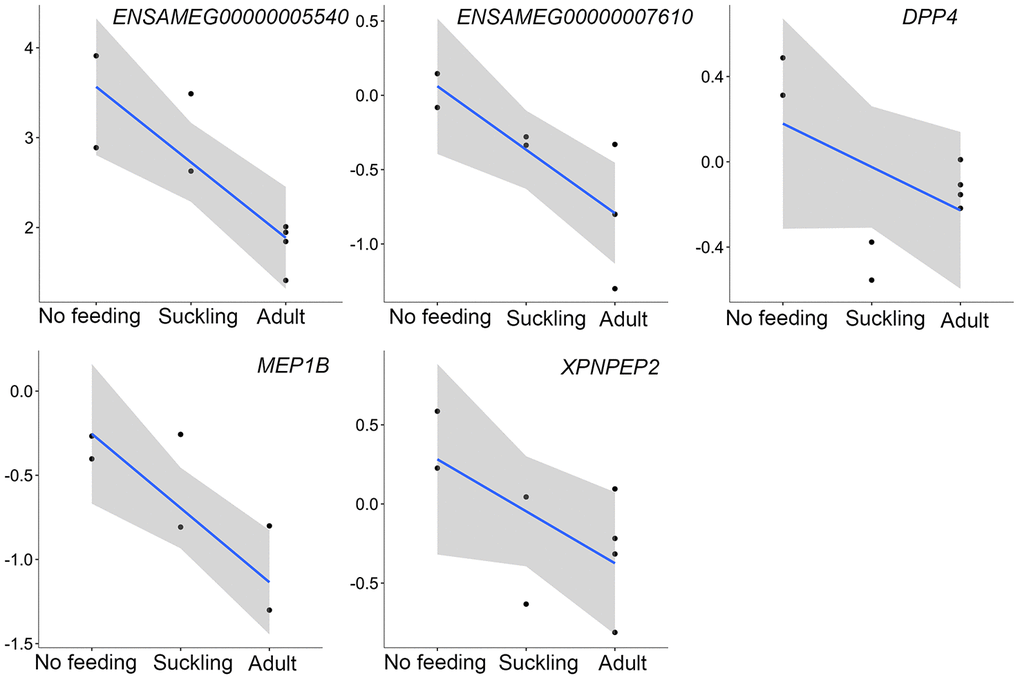
Figure 7.The expression of proteases-related genes that were continuously decreased during postnatal development in the pancreas. The vertical axis indicates the log10-transformed normalized CPM expression values. The gray shadow represents the 95% confidence field of the fitted curve.