Submit an Article
Navigate
Home
Editorial Board
Editorial Policies
Current Volume
Archive
Scientific Integrity
Publication Ethics Statements
Interviews with Outstanding Authors
Newsroom
Sponsored Conferences
Podcast
Contact
Special Collections
Submit an Article
Online ISSN: 1945-4589
Research Paper
|
Volume 12, Issue 15
|
pp. 15705–15729
Gene expression profiles during postnatal development of the liver and pancreas in giant pandas
Back to article
Figure 4
(4 of 8)
−
100%
+
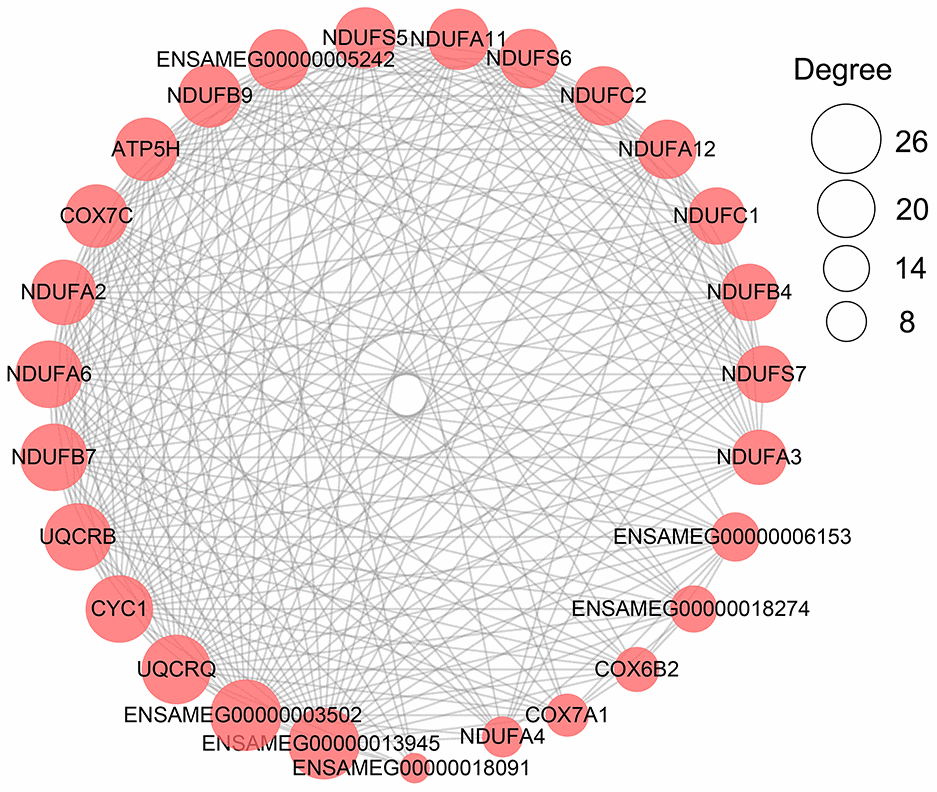
Figure 4.
The network of PPI analysis of metabolism-related DEGs in the pancreas.
The sub-network contained hub genes was extracted. The size of the circle represents the degree level of node gene. The bigger the circle, the more degree of node gene.