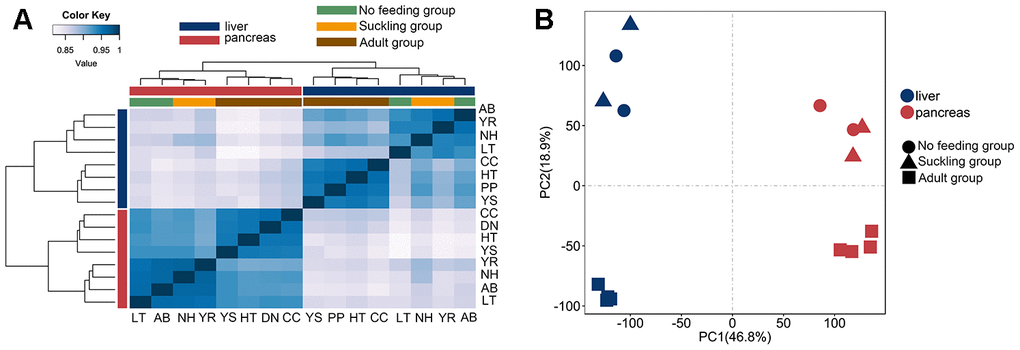
Figure 1.Clustering and PCA analyses of the expression for liver and pancreas samples. (A) Clustering of liver and pancreas samples based on log-transformed normalized CPM expression values. Distance between samples was measured by Spearman's rank correlation coefficient. (B) PCA of the log-transformed normalized CPM expression levels of all liver and pancreas samples. Species are represented by point shape. Tissues are represented by different colors.