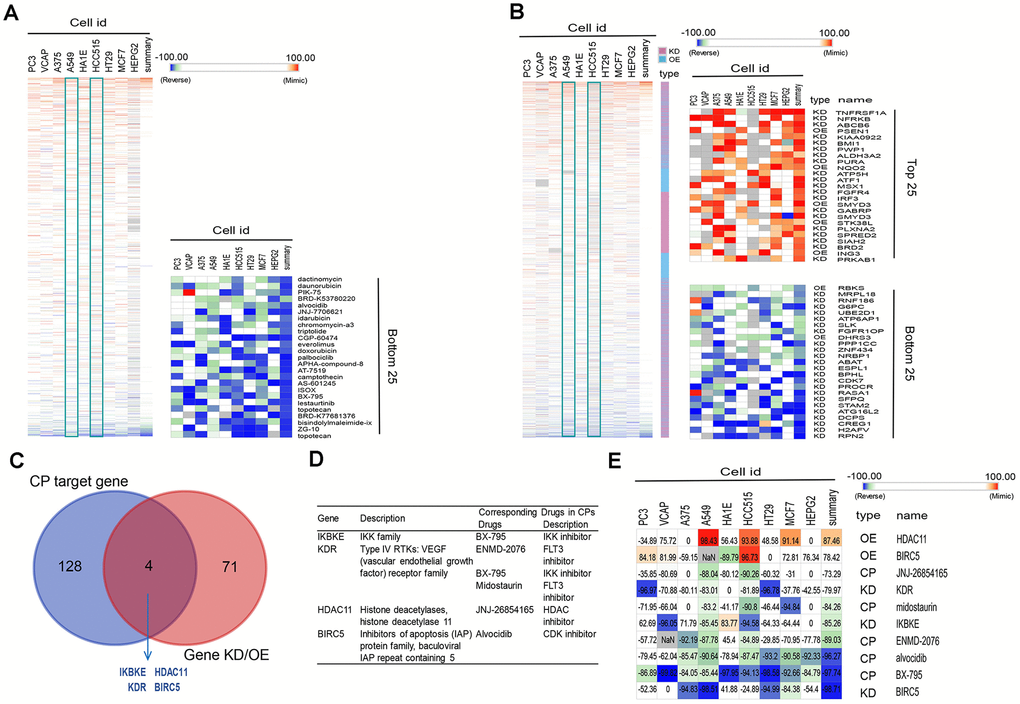
Figure 6.Connectivity mapping for the gene signature in C3 immune subtype. (A, B) Connections of C3-driven gene signature with the small molecule compounds (A) and gene knockdown/overexpression (B) were analyzed by querying the CLUE database. Connections were viewed as a heat map ranked by the summary connectivity score. (C) The venn diagram indicating the number of target genes of screened small molecule compounds (enrichment score<-80) and gene knockdown/overexpression (gene knockdown, enrichment score<-80; gene overexpression, enrichment score>80), and the overlap between each set of genes. (D) Descriptions of overlapped gene and their corresponding drugs from screened small molecule compounds. (E) Connections of C3-driven gene signature with screened small molecules and gene knockdown/overexpression were analyzed by querying the CLUE database. Connections were viewed as a heat map with each connectivity score in individual cell line. CP, compounds. KD, knockdown. OE, overexpression.