Submit an Article
Navigate
Home
Editorial Board
Editorial Policies
Current Volume
Archive
Scientific Integrity
Publication Ethics Statements
Interviews with Outstanding Authors
Newsroom
Sponsored Conferences
Podcast
Contact
Special Collections
Submit an Article
Online ISSN: 1945-4589
Research Paper
|
Volume 12, Issue 18
|
pp. 18415–18435
Association of vitamin C intake with breast cancer risk and mortality: a meta-analysis of observational studies
Back to article
Figure 2
(2 of 5)
−
100%
+
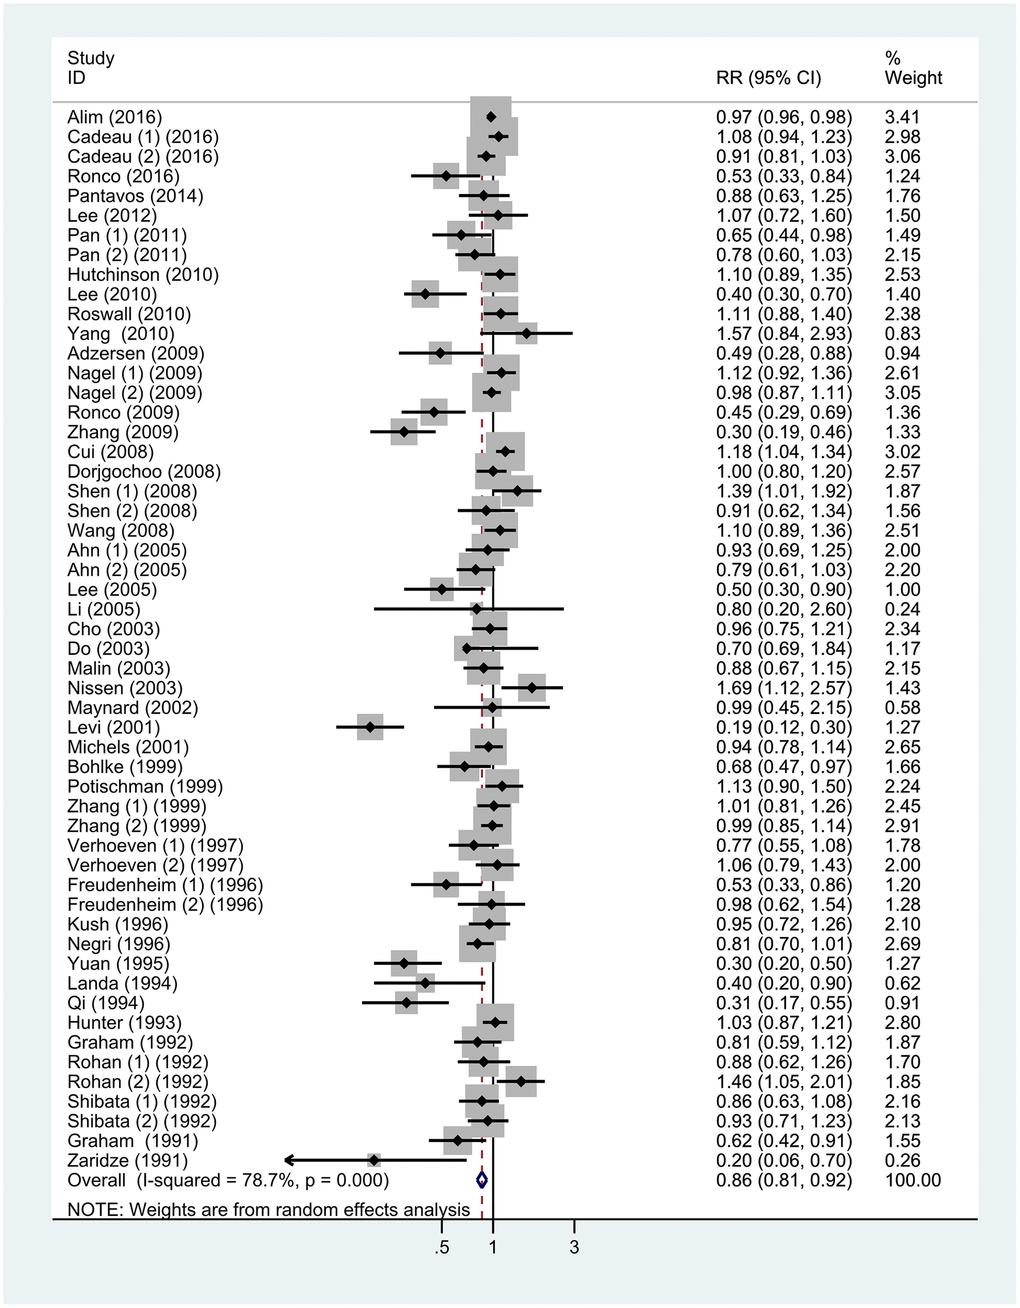
Figure 2.
Forest plot of meta-analysis of breast cancer risk in relation to highest vs lowest categories of vitamin C intake.
Note: Weights are from random-effects analysis. Abbreviations: RR, relative risk; CI, confidence interval.